Lesson 2.3
Diagonals
Ending and leading diagonal – when the impulse changes shape
In short: The Diagonal is a Motive wave, but not an Impulse—a wedge consisting of
five three-wave sub-waves in which the overlap rule is suspended. At the end of a
trend, it is called an Ending Diagonal and is the sharpest reversal pattern in Wave
Theory. At the beginning of a trend, it is called a Leading Diagonal and means the
opposite.
Classification: the one exception from Module 1
In Module 1.3, you learned: Wave 4 never enters the price territory of Wave 1. This lesson covers the one structural case where this exact overlap is permissible and typical.
The Diagonal is a Motive wave, but not an Impulse—it carries two corrective characteristics. In common with the Impulse: No reaction wave fully retraces the preceding action wave, and the third sub-wave is never the shortest. Difference: It is the only five-wave structure in the direction of the main trend in which Wave 4 almost always enters the price territory of Wave 1—and in which all sub-waves are threes. Total count: 3-3-3-3-3.
The Ending Diagonal—The Terminal Pattern
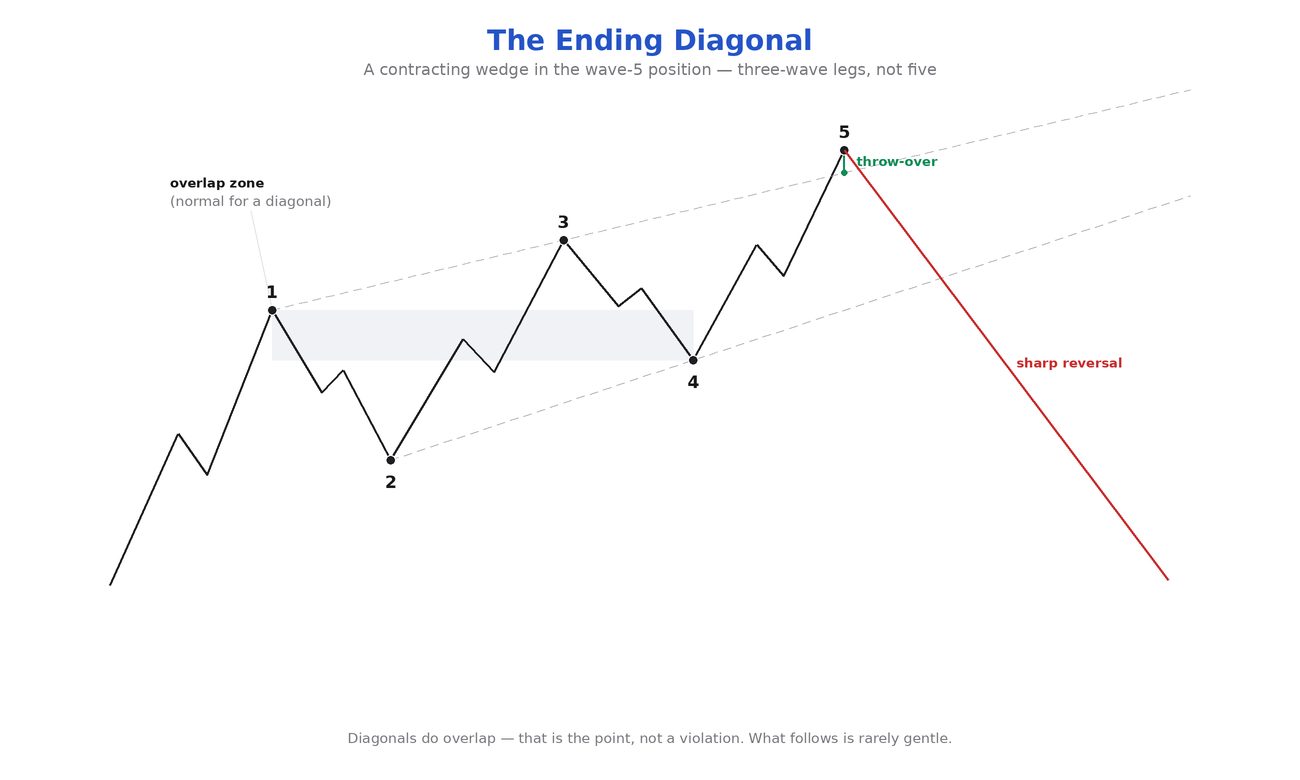
Position. The Ending Diagonal occurs primarily in the fifth wave position. A very small percentage appears in the C-wave position; in Double and Triple Threes (Module 4), it occurs exclusively as the final C-wave. It typically appears when the preceding move has gone "too far, too fast." Location tip: Around 80% of all Diagonals occur as the fifth wave of the third wave of a higher degree.
- Subdivision 3-3-3-3-3. If you find consistent threes in a supposed fifth wave at the lower degree, you very likely have an Ending Diagonal.
- Overlap. Wave 4 usually ends in the price range of Wave 1—here it's not a rule violation, but a key identifying feature.
- Shrinking waves. In the contracting form, the waves decrease in size; Wave 3 must still not be the shortest action wave. Proportions: Wave 3 ≈ 0.618 × Wave 1, the entire Diagonal tends towards 1.618 × its Wave 1.
- Throw-over. The fifth wave often ends with a brief break of the trend line connecting the end points of waves 1 and 3. Characteristic: While activity decreases during the pattern, it ends with a spike in activity at the throw-over. Do not expect the fifth wave to end exactly at the target trend line.
A relationship that signals the throw-over: If a trend line break occurs in the fourth wave (usually as a result of a triangle), the subsequent fifth wave typically also breaks the opposite channel line—to the same extent as the break in Wave 4. And a special case: If the Diagonal does not exceed the end of its third wave (Truncation, Lesson 2.4), a particularly fast and sharp reversal is to be expected.
The Leading Diagonal—The Beginning of a Trend
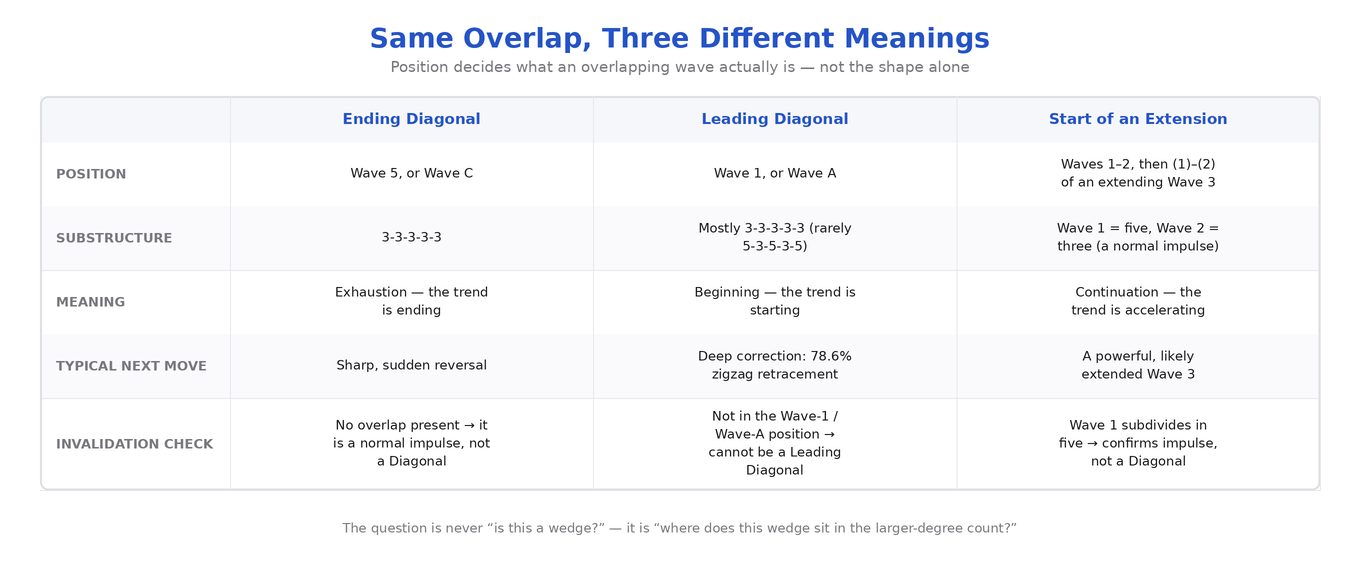
Position. The second variant occurs in the Wave-1 position of an Impulse or in the Wave-A position of a Zigzag. It looks outwardly similar to the Ending Diagonal—and means the opposite: not the end, but the beginning.
Substructure—the honest state of affairs. Documented cases predominantly show the 3-3-3-3-3 subdivision; in isolated cases, a 5-3-5-3-5 count could also be labeled—a strict definition is expressly still pending. In summary: In a Diagonal in the fifth or C position, the internal waves are threes; in a Wave-A position, the action waves can be fives. The more reliable criterion is therefore the position within the larger-degree count, not the substructure.
Why this distinction can be costly. Anyone who mistakes a Leading Diagonal for an Ending Diagonal is positioning against a newly starting trend—potentially against a third wave. Add to this the second risk of confusion from Lesson 2.2: mistaking a Leading Diagonal for the much more common sequence of first and second waves of a beginning extension. Both show overlapping waves without a clear impulse character.
The Expanding Diagonal—State of Knowledge and How to
Handle It
Treat this case for what it is: a fringe phenomenon. One case has been documented in which the boundary lines of an Ending Diagonal diverged—analytically unsatisfactory because the third wave was the shortest action wave. For the Leading Diagonal, an expanding form has also been described, predominantly at the beginning of downward moves. There is one hard distinguishing criterion: The fifth sub-wave must exceed the extreme of the third sub-wave.
Practice Note for FX
Diagonals frequently occur in leveraged markets on smaller time frames—especially in the final phase of intraday trends and in C-waves of corrections. They are often the reason why a trend "no longer runs properly," even though prices are still making new extremes. Those who know the pattern read it as an exit instead of a buy-on-dip opportunity.
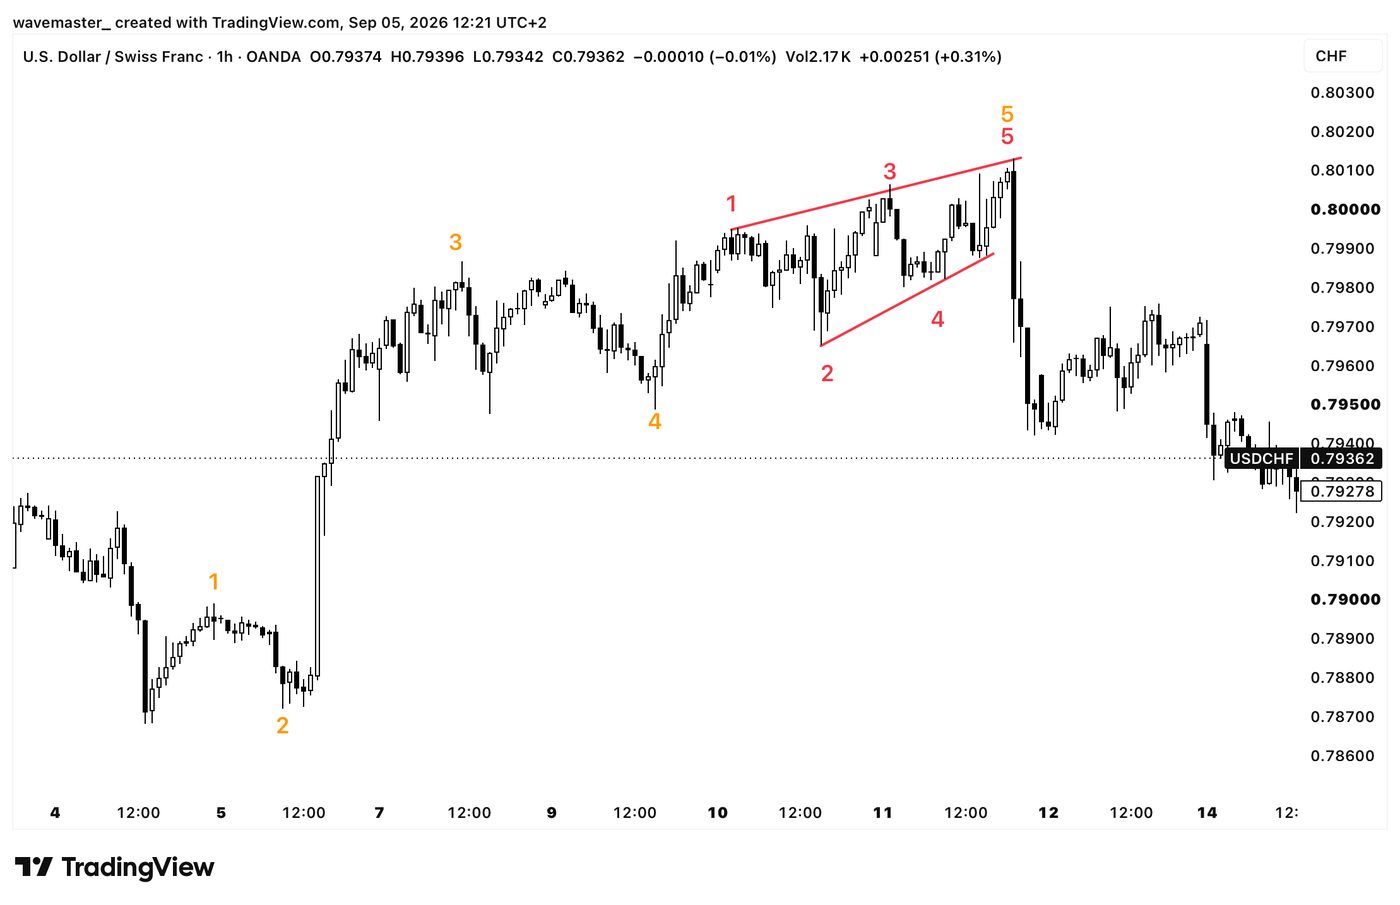
For me, wedges are always a moment to pause. Not because they are hard to see, but because the same shape can appear at the beginning and at the end of a move—and the answer is never in the wedge itself, but in the chart around it.
Knowledge check
1. How is an Ending Diagonal subdivided?
2. How long is Wave 3 typically within a Diagonal?
3. Where do about 80% of all Diagonals occur?
4. What is the minimum expectation after a completed Ending Diagonal?
5. What correction typically follows a Leading Diagonal in the Wave-1 position?
6. A contracting wedge appears right after a significant low. What is it likely to be?