Lesson 3.1
Why corrections behave differently
Corrections are never fives – sharp vs. sideways and the map of patterns
In short: Corrections move against the larger trend and have to push through
resistance — that's why they have more variations and are harder to read than
impulses. One rule covers everything: **Corrections are never fives.
When order ends
Up to this point, the world was orderly. An impulse has five waves, it has rules, and if one of them is broken, it's not an impulse. You could count, check, and decide.
Now you're looking at the counter-move. And that's where things suddenly get confusing. This isn't a flaw in your understanding, but a characteristic of the market — with a very simple cause.
The reason: two trends fighting each other
An impulse moves with the larger trend. It has a clear path and can unfold cleanly. A correction moves against the larger trend — it has to push through resistance that is stronger than itself. It's this very resistance that prevents a correction from forming a complete Motive structure.
- Corrections are harder to identify than impulses.
- Corrections are more varied in form than impulses.
- Corrections can change their complexity as they form — this makes sub-waves of the same degree appear to be of different degrees.
- The end of a correction is harder to predict than the end of an impulse.
The one rule that holds it all together
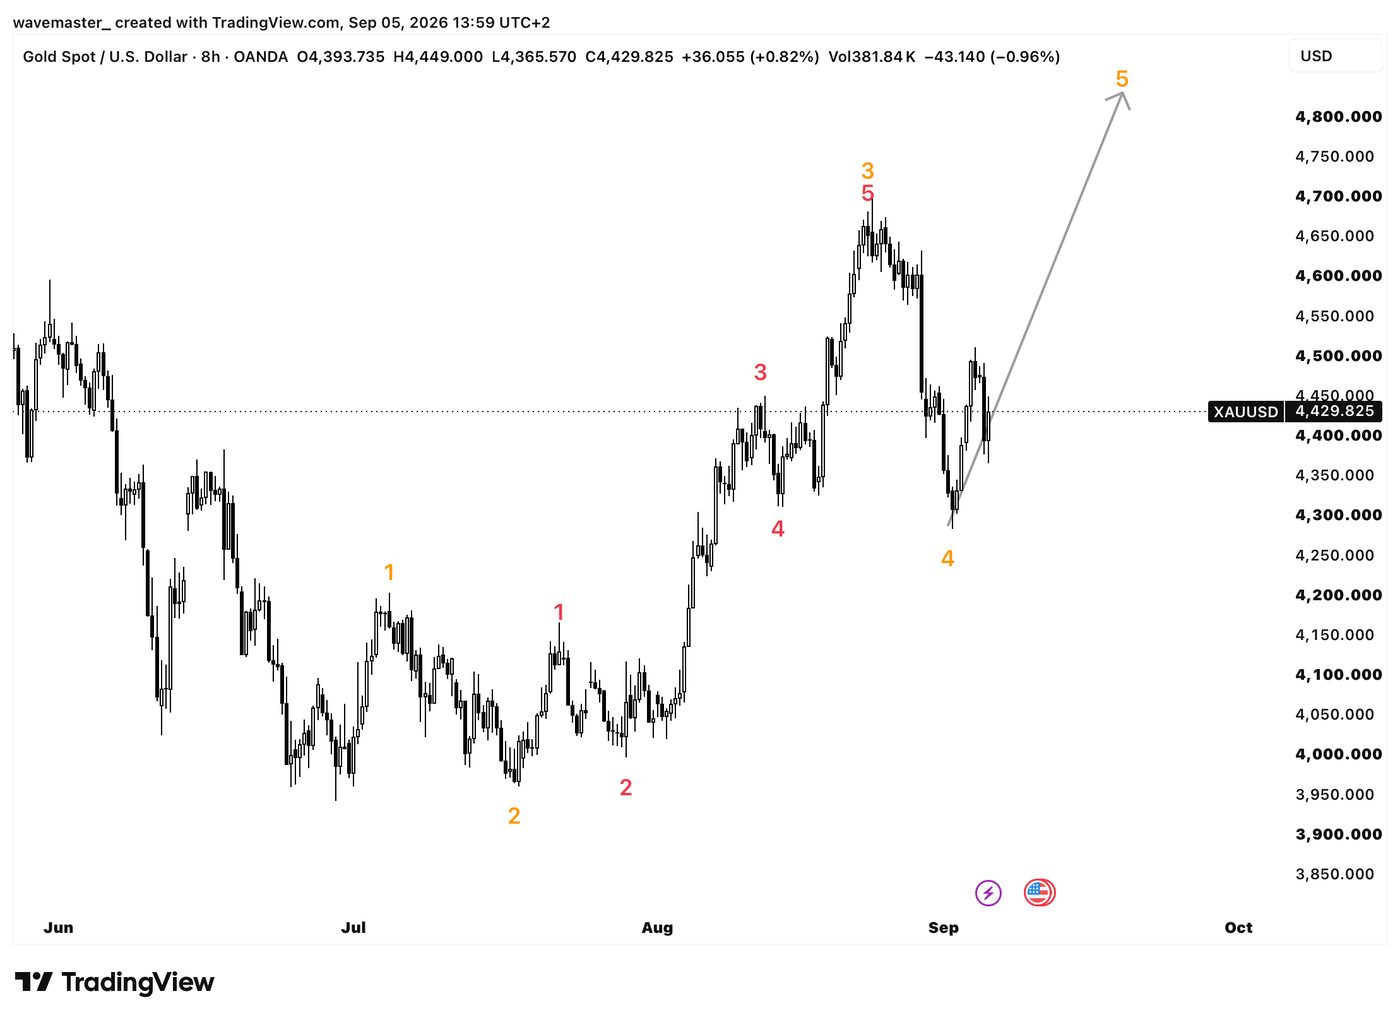
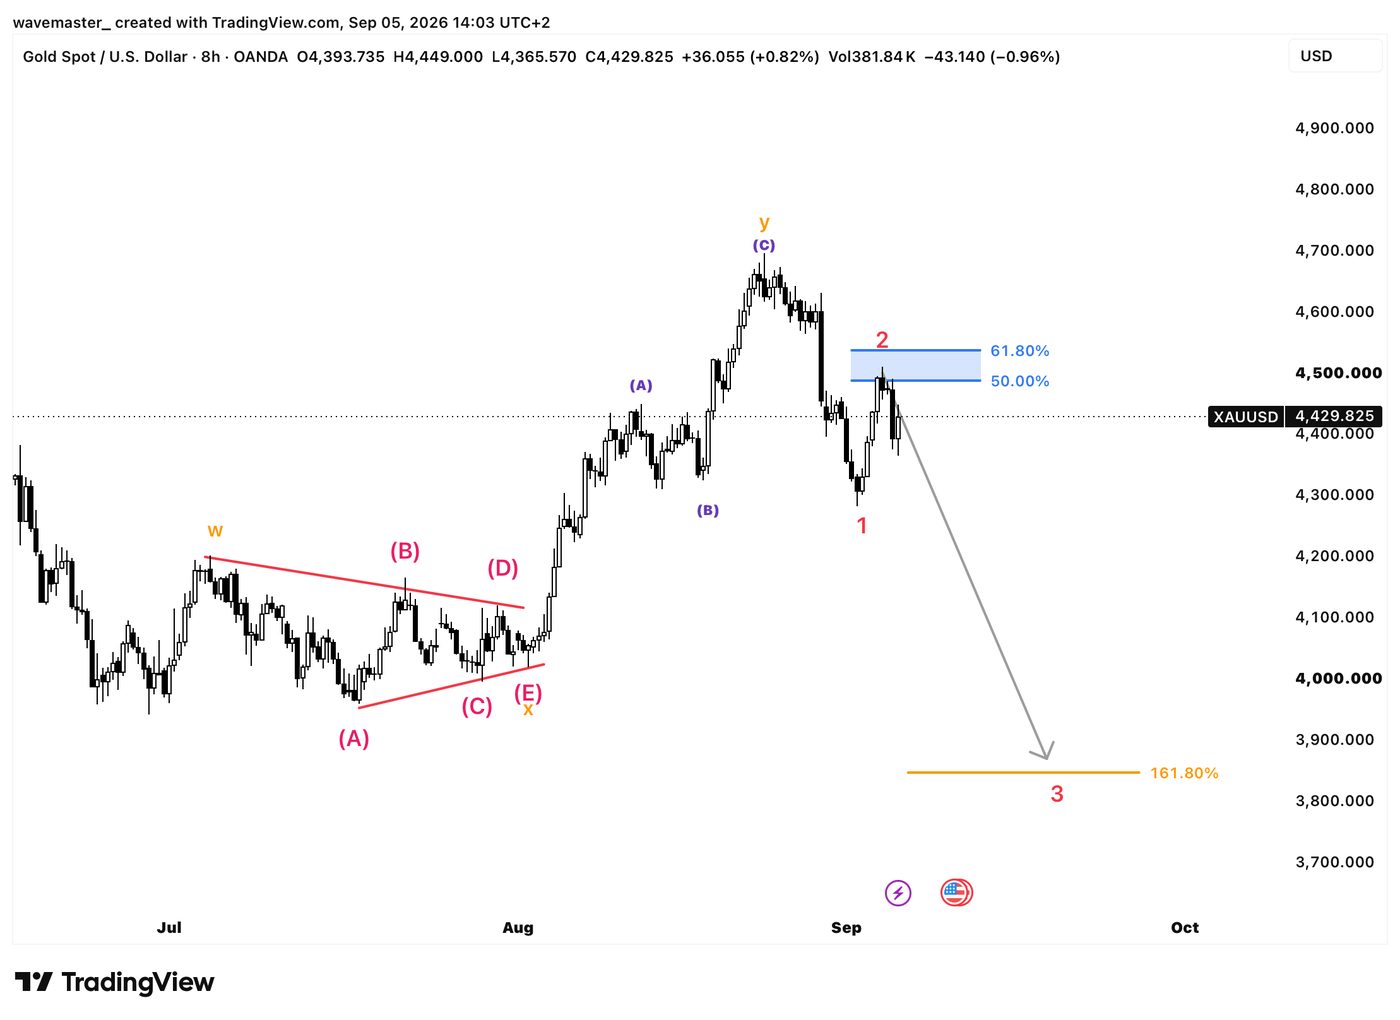
So if you count a clean five-wave move against the trend and think, "great, that was the correction, now it's moving on," you are wrong by definition. There's more to come. This one deduction has prevented more premature entries than any indicator setting.
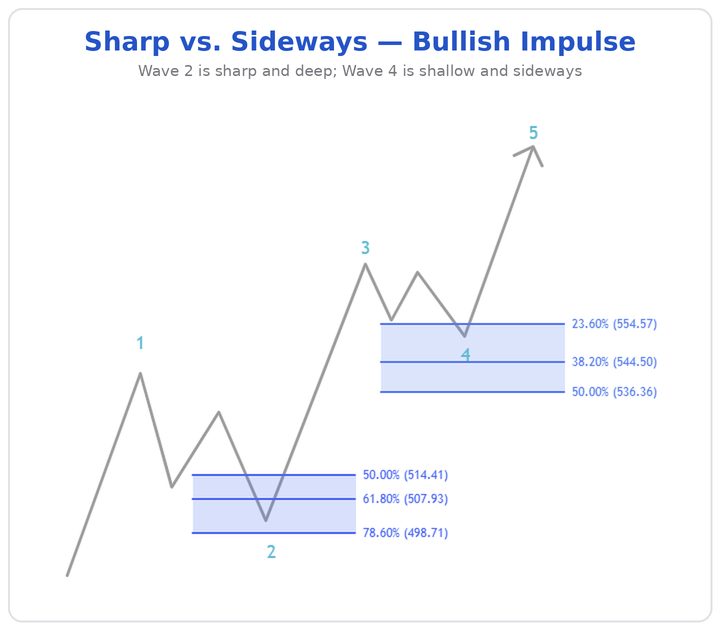
Two styles: Sharp and Sideways
| Style | Behavior | Identifying feature |
|---|---|---|
| Sharp | moves steeply against the larger | no move back beyond the end of the |
| trend | previous impulse | |
| Sideways | produces a net retracement, but | looks sideways overall, often with a |
| contains a move back to or beyond | new price extreme |
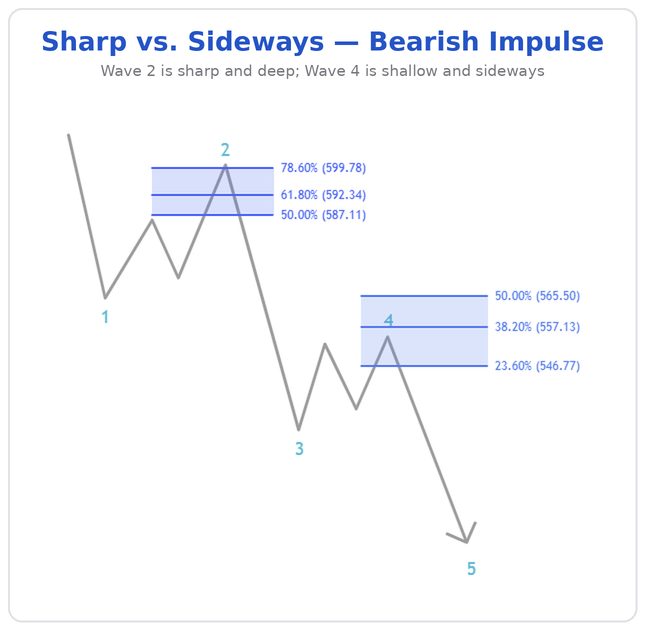
This distinction is not merely descriptive. It is the basis of Alternation — the observation that the two corrections within an impulse typically differ in character. You will get it as a tool in Lesson 3.4, and in full depth in Module 5.
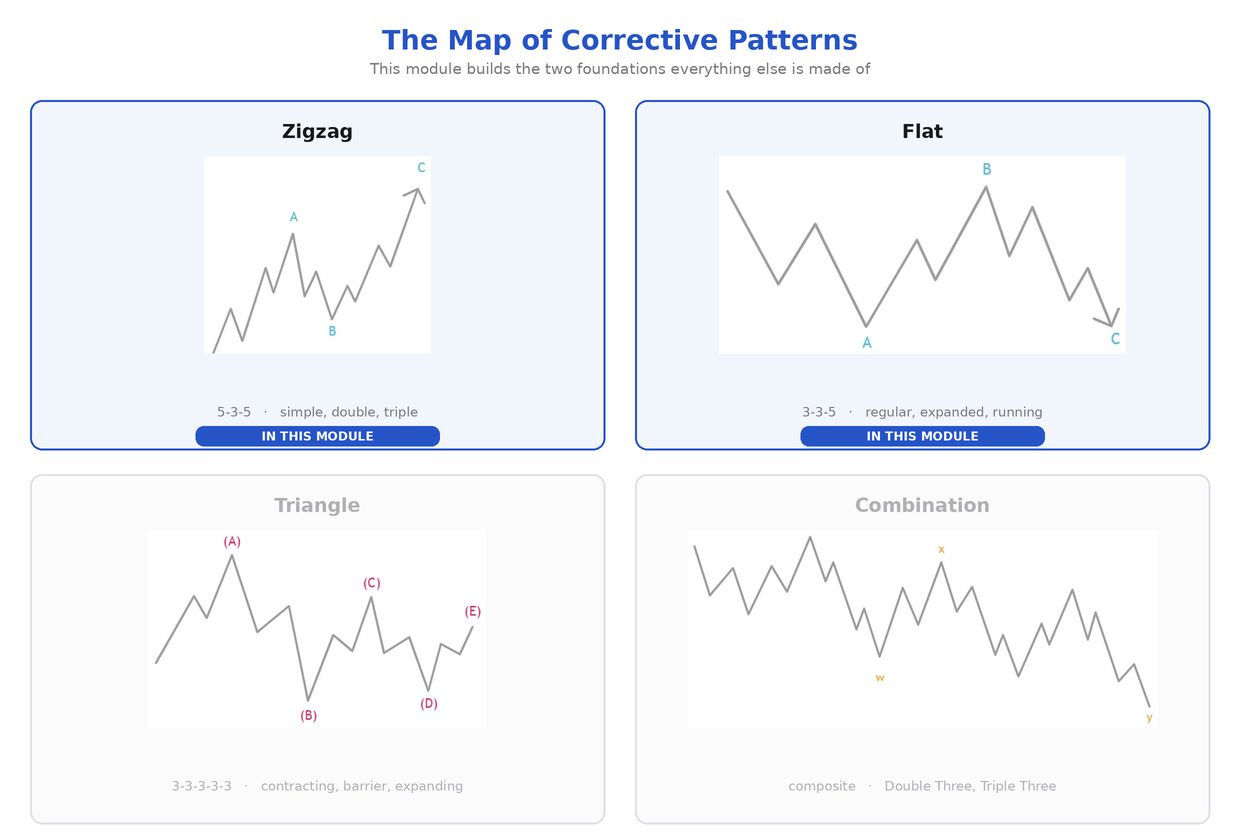
The map of corrective patterns
| Category | Substructure | Variations |
|---|---|---|
| Zigzag | 5-3-5 | simple, double, triple |
| Flat | 3-3-5 | regular, expanded, running |
| Triangle | 3-3-3-3-3 | contracting, barrier, expanding (+ |
| Combination | composite | Double Three, Triple Three |
In this module, you will learn the Zigzag and the Regular Flat — the two basic forms from which everything else is built. This is not an arbitrary cut: A Double Three consists of Zigzags and Flats connected by an intermediate wave. If you can't reliably identify the building blocks, you can't read the composite pattern at all.
Why the effort is worth it
In a typical five-wave sequence, only about 30 to 35 percent of the time is spent in impulse waves. The rest is correction — overall, about 70 percent is consolidation.
Money is made in the impulse phases; it's lost in the corrections.
Those who can't read corrections spend two-thirds of their screen time in a state they don't understand.
Knowledge check
1. How many waves does a correction never have?
2. What is the substructure of a Zigzag?
3. You count a clean five-wave move against the larger trend. What do you know for sure?
4. Which style typically contains a new price extreme?