Lesson 3.3
The regular flat
3-3-5, the 90 percent threshold and what a flat says about the trend
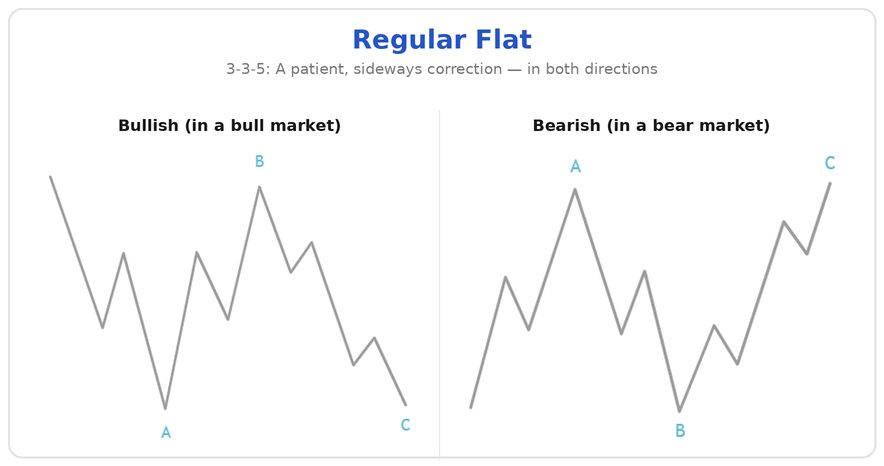
In short: The Flat is the patient correction — A-B-C with a **3-3-5** substructure. What
sets it apart from the Zigzag: Wave B retraces at least **90%** of Wave A. A Flat is a
sign of **strength** in the higher-degree trend — not weakness.
The Construction Rules
| Wave | Substructure | Meaning |
|---|---|---|
| A | three-part | corrective — this is the key |
| B | three-part | corrective — travels back a long way |
| C | five-part | motive |
The logic behind it is elegant: Wave A doesn't have enough counter-force for a full five-wave move — it stops at three. This weakness is passed on: Because A was weak, B can retrace almost the entire way and ends near the starting point of A. Wave C ends only slightly beyond the end of A. The result: a broad sideways channel instead of a sharp move.
The Hard Rules
1. A Flat always subdivides into three waves. 2. Wave A is never a Triangle. 3. Wave C is always an Impulse or a Diagonal. 4. Wave B retraces at least 90% of Wave A.
| Observation in Wave B | Diagnosis |
|---|---|
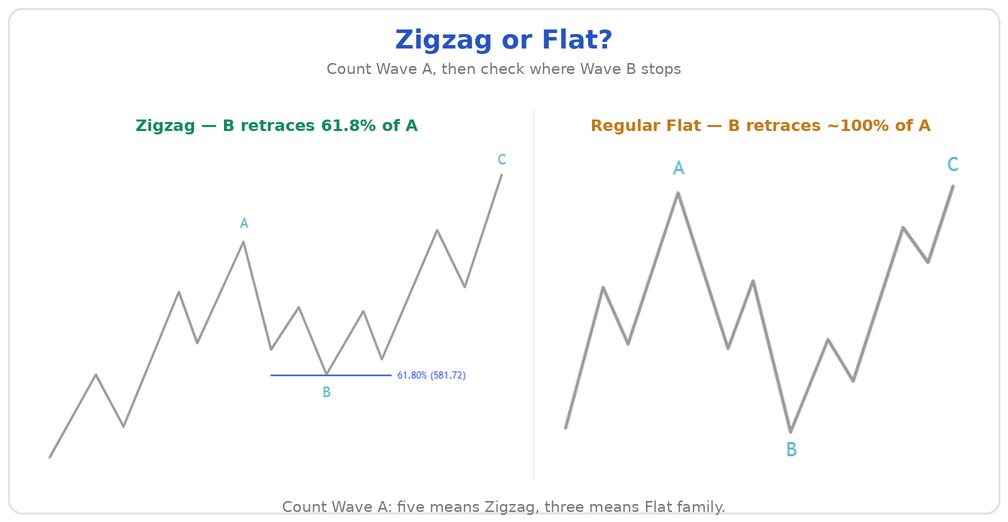
| B retraces less than 90% of A | Zigzag family |
| B retraces at least 90% of A | Flat family |
The Guidelines
- Wave B usually retraces 100%–138% of Wave A.
- Wave C is usually 100%–165% as long as Wave A.
- Wave C usually ends beyond the end of Wave A.
- For the Regular Flat, the narrowest form applies: B ends approximately at the starting level of A, and C ends a little beyond the end of A — so A ≈ B ≈ C.
Divergence of Sources: The Flat Proportions
- Stock Market Basis: In a Regular Flat, A, B, and C are approximately equal in length.
- FX Basis: Different ratios are used here — C = 0.618 × A as well as C = 1.382 × A or C = 1.618 × A.
The reason is likely terminological: FX literature separates "flat" and "irregular" into their own categories, while standard literature groups both under "Flat". For the Regular Flat, you work with the simple approximation A ≈ B ≈ C.
- If a correction begins with a Flat, the worst-case scenario is a 61.8% retracement of the
- A C-Failure, where C fails to reach the end of A, is quite common for Flats in the forex market.
Where Flats Appear — and What They Tell You
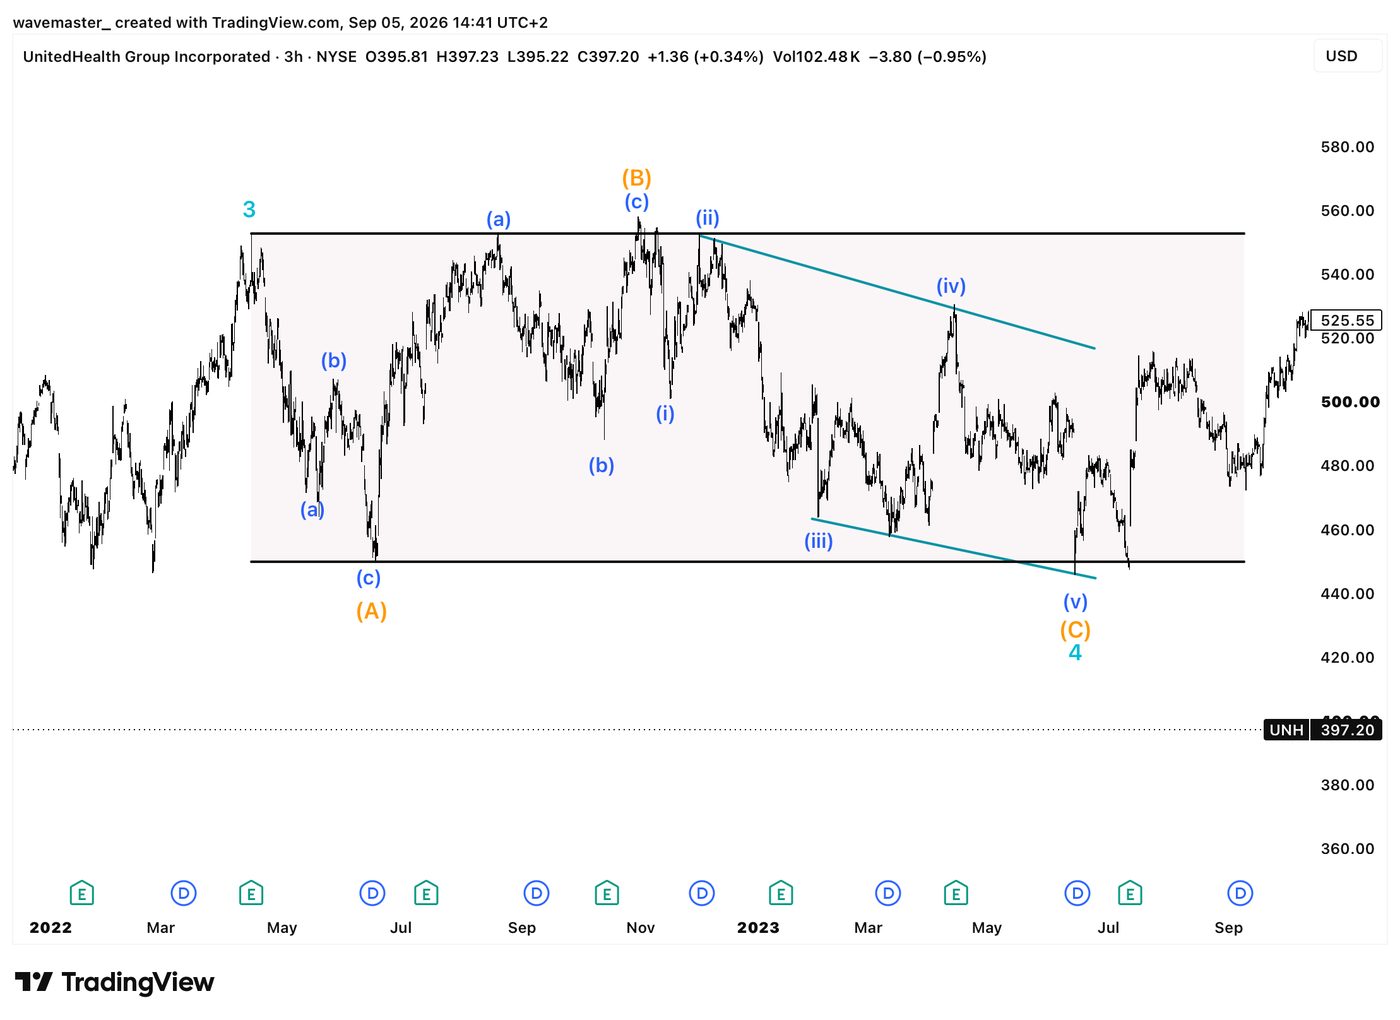
A Flat generally retraces less than a Zigzag. It typically occurs when the higher-degree trend is strong — which is why it almost always appears directly before or after an Extension (Module 2.2).
Zigzag or Flat? The Decision Aid
| Criterion | Zigzag | Regular Flat |
|---|---|---|
| Substructure | 5-3-5 | 3-3-5 |
| Wave A | five-part (motive) | three-part (corrective) |
| Wave B retracement | less than 90% of A | at least 90% of A |
| Hard limit for B | never above the start of A | — |
| Overall impression | sharp, directional | sideways, broad |
| Retracement of the impulse | deep, often ≥ 61.8% | shallower |
| Criterion | Zigzag | Regular Flat |
| Typical position | Wave 2 | Wave 4 |
| Statement about the trend | normal breather | higher-degree trend is strong |
Outlook: What's Still Missing
There are variations where B moves beyond the starting point of A and creates a new price extreme: the Expanded Flat and the Running Flat. This is not a marginal phenomenon — the Expanded Flat occurs more frequently than the Regular Flat and is very common, especially in the forex market. Both variations, with their thresholds and target zones, are the introduction to Module 4.
Knowledge check
1. Substructure of the Flat?
2. Wave B of a Flat retraces at least what percentage of A?
3. Wave A consists of three waves. Which family can you rule out?
4. A Flat turns out to be very short. What does this tell you about the higher-degree trend?