Lesson 2.5
Fibonacci in the impulse
From structure to price target: retracements, projections, R
In short: Retracements tell you how deep counter-waves correct; projections, how far
action waves run. Together with the rules from Module 1, this gives you an entry,
stop, and target — and thus your first complete trade from a wave analysis.
Why Fibonacci at all
The relationship is inherent in the structure itself: 1 cycle, 2 phases, 8 waves; one degree lower 34; below that 144. The wave counts of the individual degrees — 1, 2, 3, 5, 8, 13, 21, 34, 55, 89, 144 — are exactly the Fibonacci sequence. This leads to an often-overlooked side benefit: The wave count is a consistency check. If you end up with odd numbers, you have mixed up two degrees somewhere.
Retracements: how deep do the counter-waves correct?
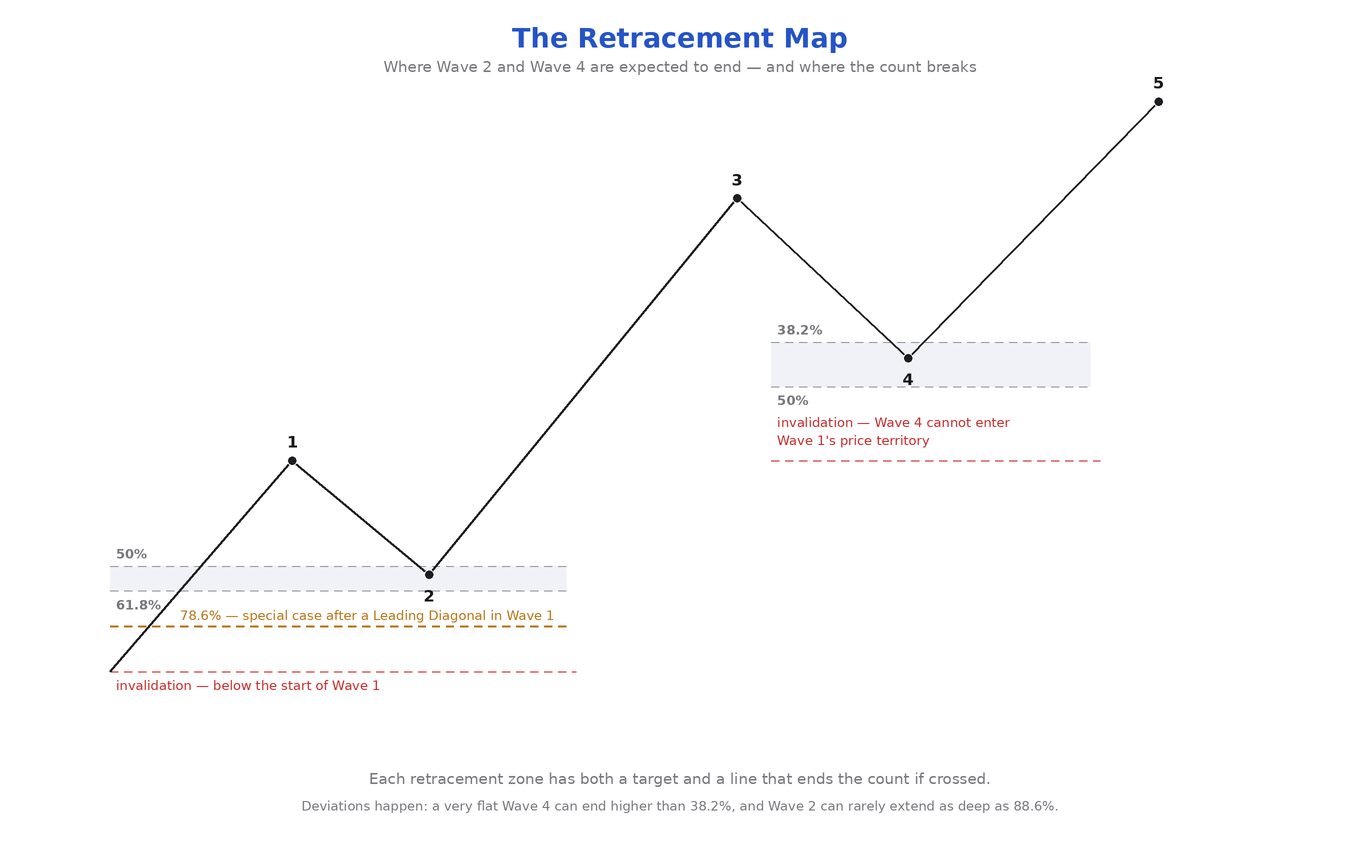
The basic distinction is not “wave 2 versus wave 4,” but sharp versus sideways. Sharp corrections tend to retrace 61.8% or 50% of the preceding wave — especially as wave 2 of an Impulse. To be more specific for the currency market: Wave 2 tends to retrace 61.8% or more of wave 1; if it fails to do so, 50% is the next most common level. Limitation: If the correction begins with a sideways pattern (Flat, irregular, Triangle), the damage is usually limited to 38.2% — a retracement that does not exceed 38.2% indicates pent-up strength in the original direction.
Sideways corrections tend to retrace 38.2% of the preceding impulse wave — especially as wave 4. Rarely expect the 61.8% level in wave 4; if the market does reach it, seriously check your labeling. The hard limit remains the overlap rule.
The special case of 78.6%: exactly one documented context — as a Zigzag retracement after a Leading Diagonal in the wave 1 position (Lesson 2.3). It is not documented as a general wave 2 target. And a correction of expectations: Retracements come in all sizes. The values mentioned are tendencies, not targets.
Projections: how far do the action waves run?
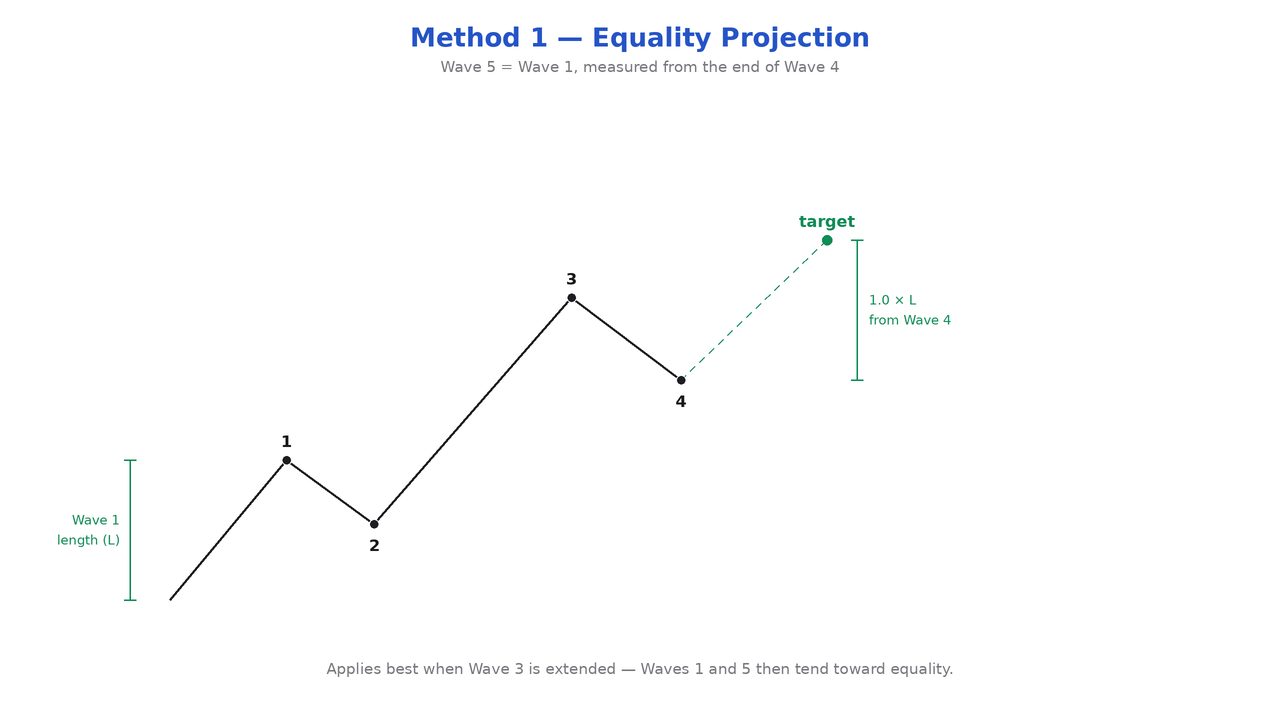
All three Motive waves tend to be related to each other via Fibonacci mathematics — through equality, 1.618 or 2.618 (reciprocals 0.618 and 0.382). On the small degrees you trade in FX, arithmetic and percentage scaling yield practically the same result — you can calculate in pips.
Wave 3 is derived from the length of wave 1, measured from the end of wave 2: Once wave 3 has exceeded the length of wave 1, you project 1.618 × wave 1; if it extends, 2.618 × and beyond follow. The 161.8% level has a dual function: If it is broken swiftly and without consolidation, this is your early indicator of an extension. Warning: The end point of the third wave is the most difficult to predict — treat 161.8% as a point of highest probability, not as an automatic exit.
| Situation | Projection for Wave 5 |
|---|---|
| Wave 3 extended | Equality with wave 1 (price, often also time); |
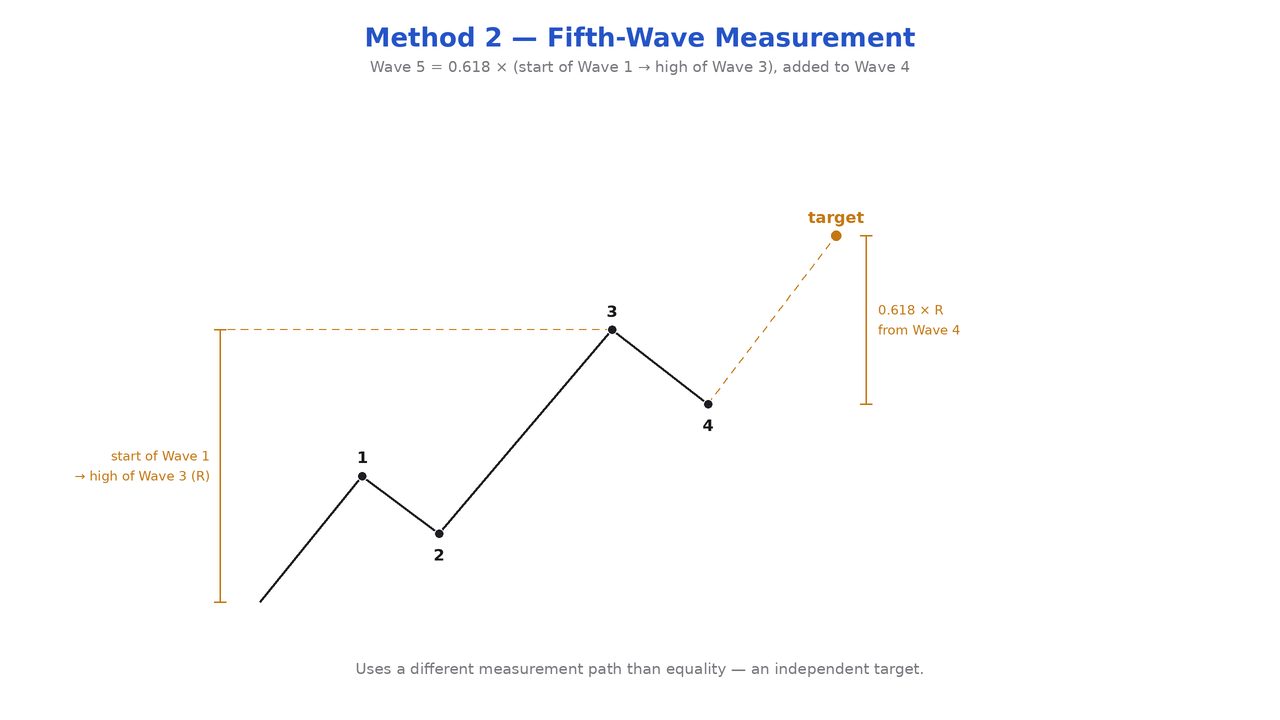
| Wave 1 and 3 not extended | 0.382 or 0.618 of the distance origin of wave 1 → end of |
| Wave 5 itself extends | 1.618 × the entire distance from the origin of wave 1 to |
| Wave 1 extended (rare) | Wave 2 often divides the entire impulse wave at the |
The Golden Ratio rule for wave 4: Provided wave 1 is not extended, wave 4 often divides the price range of the entire impulse wave at the Golden Ratio — the upper section is 0.382 of the total distance if wave 5 is not extended, and 0.618 if it is. Because the exact dividing point varies within wave 4, the guideline produces two to three closely spaced targets instead of a single line.
Confluence instead of Precision
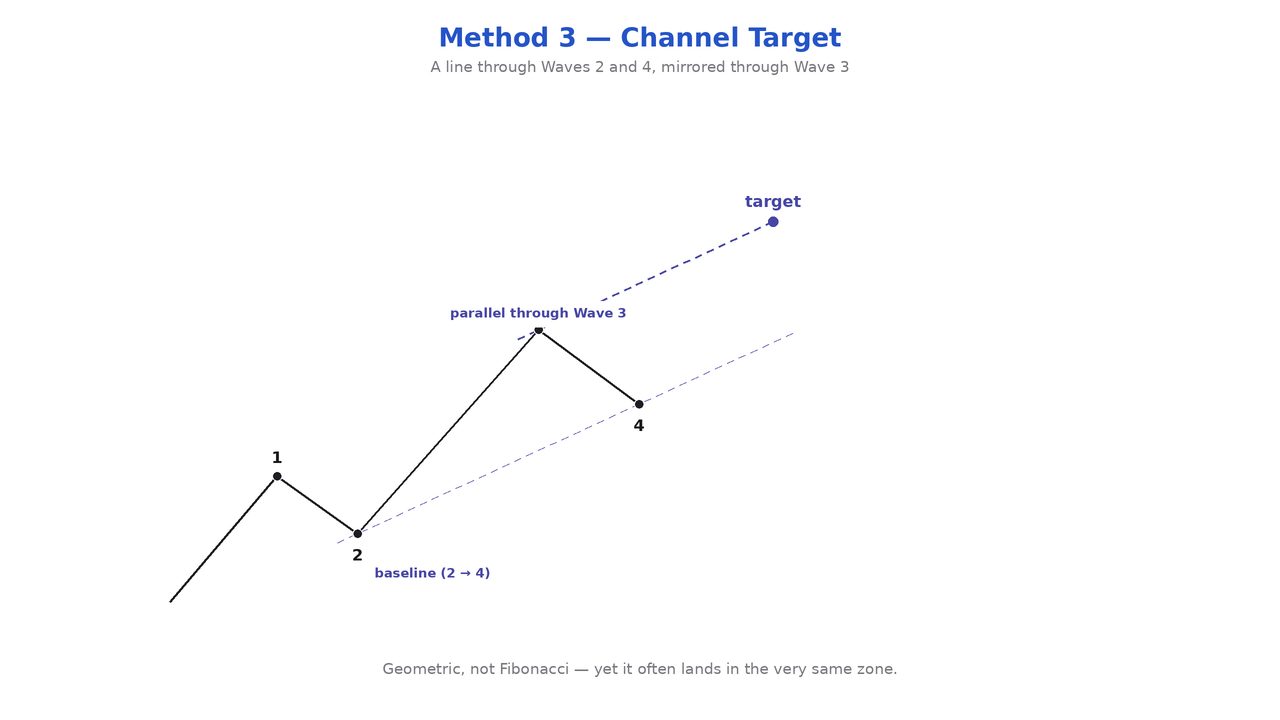
Turning points in the currency market are easiest to spot when time and price projections fall into the same area and an acceptable wave pattern has been completed. And for your stop management: Fibonacci targets usually act as significant support or resistance levels — even if they are later broken. A brief overshoot invalidates neither the level nor your analysis.
How to build a trade from this
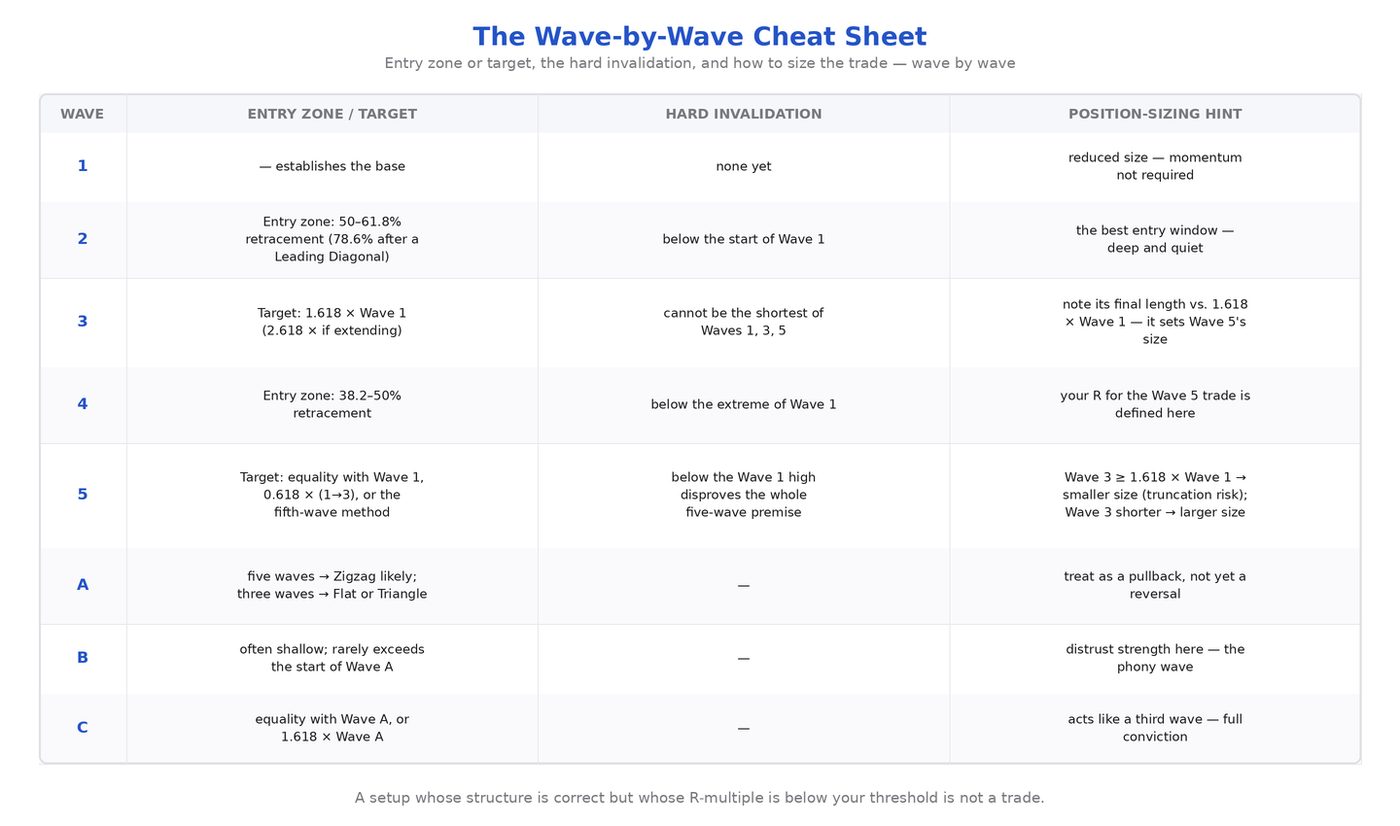
1. Entry Zone — from the retracement of the counter-wave: for wave 2 the 50–61.8% area, for
2. Invalidation — from the rules, not from the Fibonacci value: for wave 2 just below the start of
3. Target — from the projection of the following action wave: for wave 3, 1.618 × wave 1; for wave
4. Position Size — from the length ratio of the waves (see table). 5. The Decision — entry, stop, and target give you your R-multiple before entering.
| Observation at Wave 3 | Expectation | Consequence for the Wave 5 |
|---|
| at least 1.618 × wave 1 (already | Extension of wave 5 unlikely, | smaller position |
| extended) | probability of truncation increases | |
| shorter than 1.618 × wave 1 | Extension of wave 5 very likely | larger position |
Confluence is the reason I no longer argue about individual Fibonacci levels. If three independent measurements show the same zone, I don't need a fourth opinion — and if they don't, I don't need a trade.
Knowledge check
1. Between which waves do the most reliable Fibonacci relationships exist?
2. Which retracement is most typical for wave 4?
3. How do you derive the standard target for wave 3?
4. Wave 3 is significantly shorter than 1.618 × wave 1. What is your conclusion for entering wave 5?
5. Wave 1 runs from 1.0800 to 1.0900, wave 2 ends at 1.0838. Where is the 161.8% target for wave 3?
6. True or false: “A broken Fibonacci target was worthless.”