
Elliott Wave Essentials · 40 min · Advanced
Fibonacci and Elliott Waves
Discover the connection between Fibonacci numbers and wave patterns.
🔢 Introduction: The Magic of the Fibonacci Sequence
The Fibonacci sequence is one of the most fascinating discoveries in mathematics. It was described in the 13th century by Italian mathematician Leonardo Fibonacci and follows a simple yet profound principle: each number is the sum of the two preceding ones – 1, 1, 2, 3, 5, 8, 13, 21...
This number sequence appears everywhere in nature: in the arrangement of leaves on plants, the spirals of shells and galaxies, in the shape of hurricanes, and even in the growth pattern of pine cones. Nature seems to follow an invisible mathematical harmony – a rhythm reflected in structures, proportions, and movements.
Exactly this natural rhythm can also be observed in financial markets. Price movements on the stock exchange often follow similar patterns of expansion and correction, which can be described remarkably well with the principles of the Fibonacci sequence. Traders use this knowledge to recognize where markets become exhausted or new impulses might begin.
Fibonacci tools – especially retracements and extensions – help visualize these natural movements in price movements. You measure a move (for example, a rise) and then subtract the counter-move from that distance to calculate potential targets or turning points. This way, the mathematical order of nature becomes visible even in seemingly chaotic market activity.
In the following sections, you will learn how to use these tools practically to better understand market movements and recognize the patterns behind price action.
1, 1, 2, 3, 5, 8, 13, 21, 34, 55, 89...
Elliott recognized that these ratios also appear in market movements.
The most important Fibonacci Ratios
23.6% - Minimal correction
38.2% - Moderate correction
50.0% - Most common correction (not Fibonacci, but important!)
61.8% - The "Golden Ratio" (Phi) ⭐
78.6% - Deep correction
161.8% - Extension
261.8% - Strong extension
Fibonacci in every wave
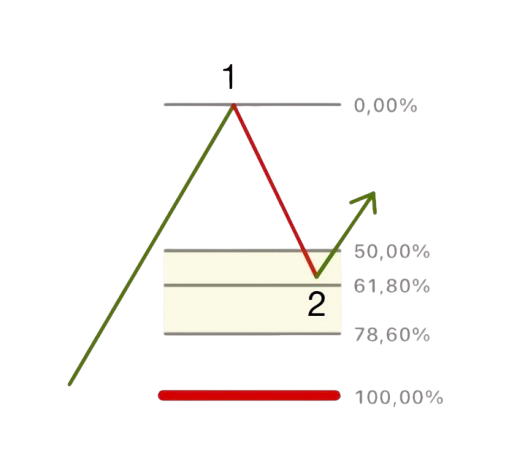
Wave 2/B (First Correction)
📉 Typically corrects 50–61.8% of Wave 1/A
📉 Sometimes up to 78.6%
⚠️ Must NEVER reach 100% (= rule violated!)
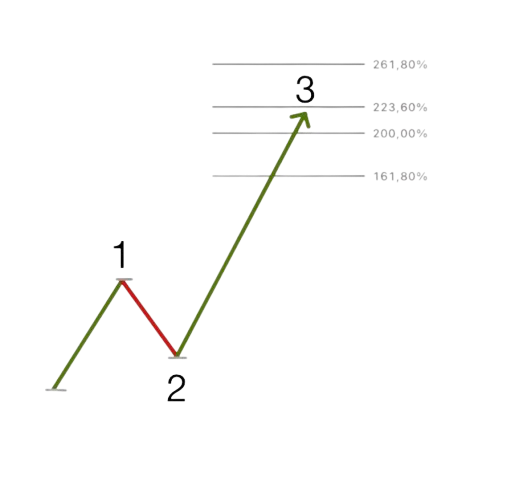
Wave 3 (Strongest Impulse Wave)
🚀 Usually 161.8% of Wave 1
🚀 Can also reach 200% or 261.8%
💡 The longer Wave 3, the stronger the trend
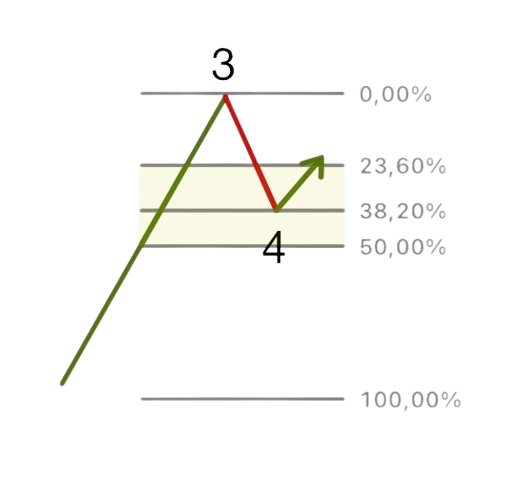
Wave 4 (Second Correction)
📊 Often 38.2% of Wave 3
📊 Alternatively 23.6% (flat correction)
📊 Rarely deeper than 50%
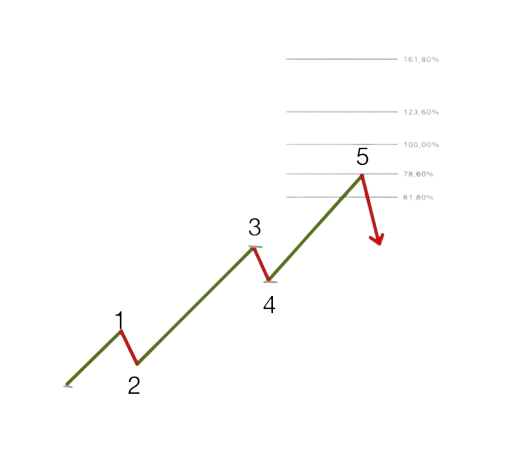
Wave 5 (Final Move)
💰 Often 100% of Wave 1 (same length)
💰 Or 61.8% of the distance from Wave 1 to 3
💰 With extensions: 161.8% possible
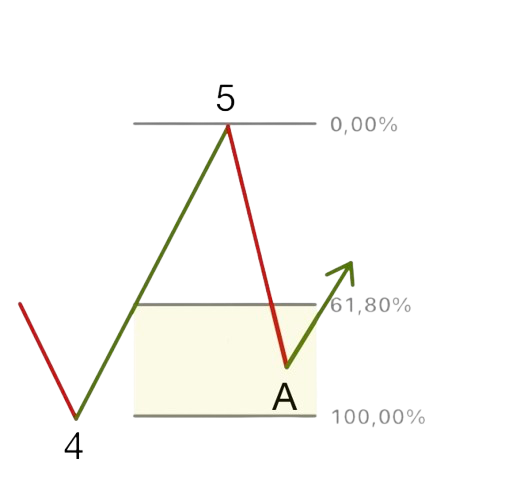
Correction Wave A
⬇️ Often 61.8% of Wave 5
⬇️ Or 100% of Wave 5
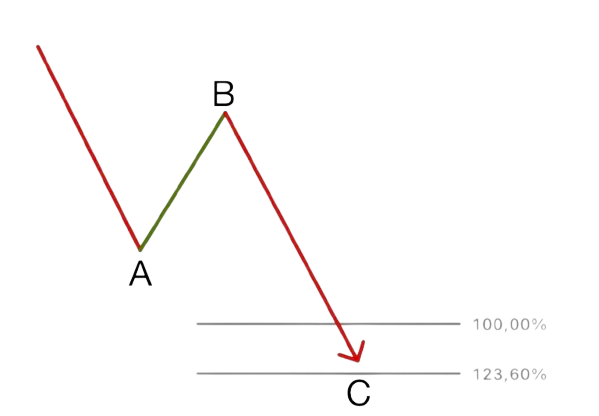
Correction Wave C
⬇️ Usually same length as Wave A 100% or 123.6%
⬇️ Or 161.8% of Wave A (Expanded Flat!)
Practical Application in Trading
1. Finding Entry Points
✅ Wait for 61.8% retracement in Wave 2 → Entry for Wave 3
✅ 38.2% correction in Wave 4 → Last entry for Wave 5
2. Setting Profit Targets
✅ Wave 3 Target: 161.8% extension of Wave 1
✅ Wave 5 Target: 100% of Wave 1 length OR 61.8% of (Wave 1 to 3)
3. Risk Management
✅ Stop-Loss: 0.618 above Wave 4 High
✅ Use Fibonacci ratios for position sizing
4. Advanced Usage
✅ Combine with Fibonacci Extensions for profit target
✅ Use retracements as dynamic support/resistance
✅ Fibonacci cluster = particularly important zones
⚠️ Common Mistakes
❌ Using too many Fibonacci levels simultaneously
❌ Fibonacci as single indicator without context
❌ Perfectionism – accept deviations of ±2-3%
🎯 Key Takeaways
✅ Fibonacci ratios are not guaranteed, but statistically frequent
✅ Use them as additional confirmation, not as single signal
✅ Combination with other tools (trendlines, support/resistance) is important
✅ Regular practice with charts improves your intuition
Reversibility of structures
Every wave structure shown here can also appear inverted in a different market phase. An impulsive move in an uptrend, for example, appears mirrored in a downtrend.
What matters is always the direction of the higher-degree trend — the patterns stay the same, only their orientation changes.
Keep reading for free
Log in or create a free WaveMaster account to unlock this lesson — and every module, Trading Basics and the Elliott Wave Essentials.