Lesson 0.1
Reading charts & timeframes
Price, time, currency pairs, pips and the resolution of the picture
What a Chart Shows
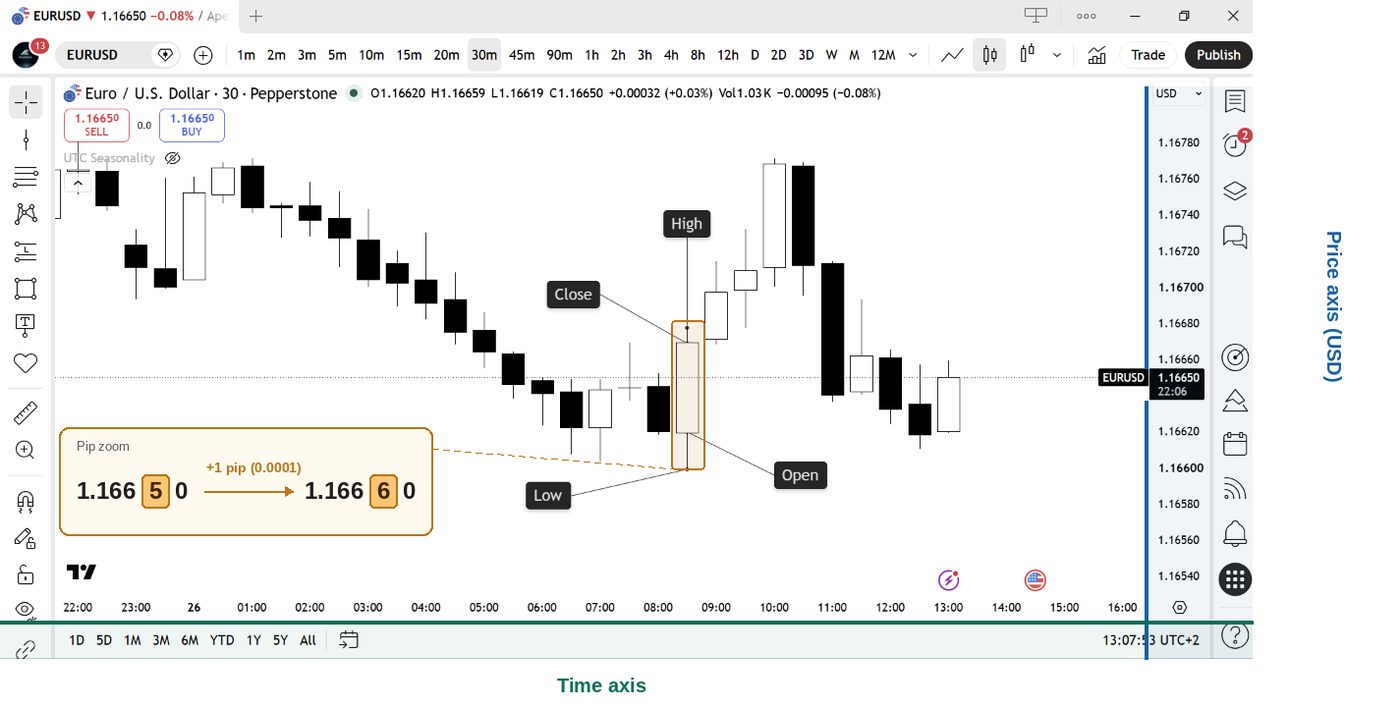
A chart is an image with two axes. Time runs from left to right along the bottom. Price is on the side. Every point on the chart answers a question: What did it cost at this point in time? There are two basic representations. The line chart only connects the closing prices — a smooth line, good for an overview. The candlestick chart shows four prices per time segment at once. It is the standard in trading — and the standard in this learning path. How to read a candle is the topic of the next lesson.
Currency Pairs: What's Actually There
In the foreign exchange market (English: Forex, short FX), a pair is always traded. EURUSD means: the price of one Euro, expressed in US Dollars. The first currency is the base currency, the second is the quote currency.
If EURUSD is at 1.0850, one Euro therefore costs 1.0850 Dollars. If the chart rises, the base currency strengthens: The Euro costs more Dollars. If the chart falls, it weakens.
The smallest classic price unit is called a pip. For most pairs, this is the fourth decimal place: From 1.0850 to 1.0851 is one pip. (Exception: Pairs with Japanese Yen — there it's the second decimal place.) Many brokers show a fifth digit; these are tenth-pips. In FX, pips measure how far something has moved — just like distances are measured in kilometers.
The Market That (Almost) Never Sleeps
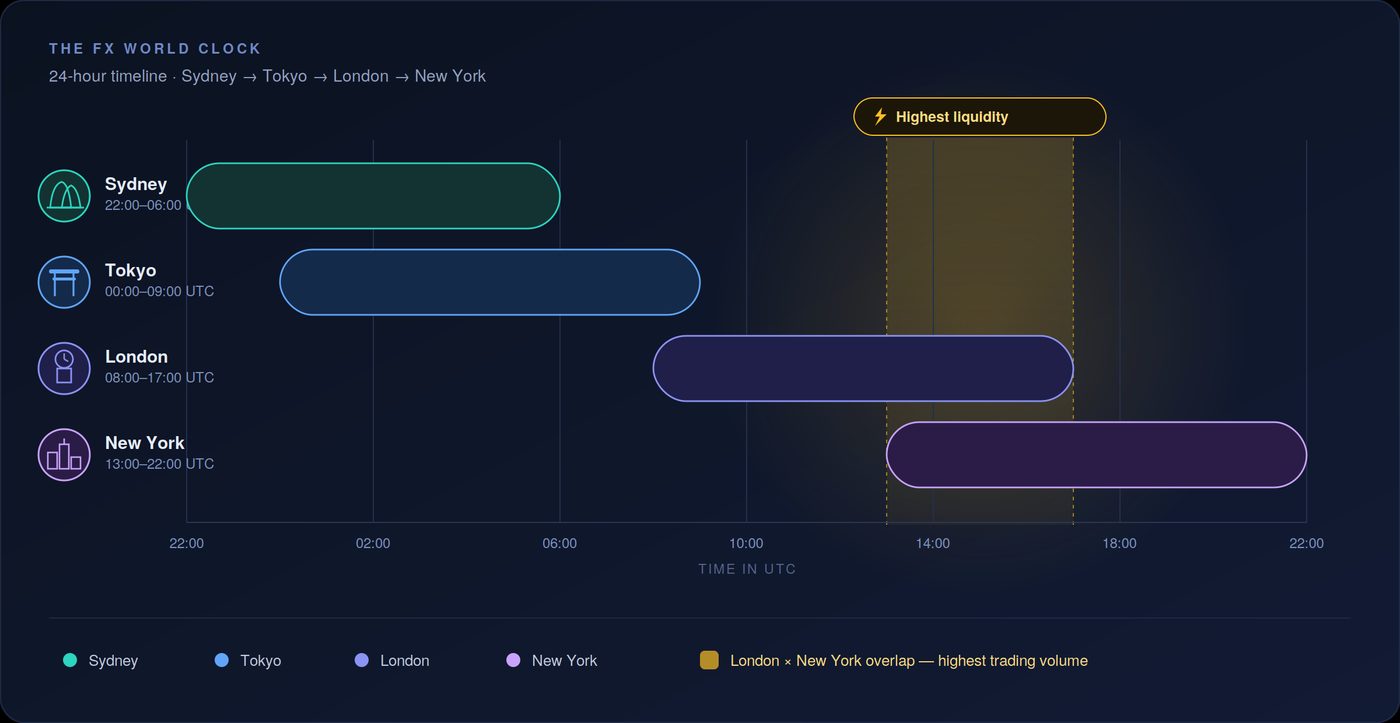
The foreign exchange market has no central exchange with opening hours. It runs 24 hours a day, five days a week — from Monday morning in New Zealand to Friday evening in New York. During this time, activity moves around the globe: Sydney and Tokyo start, then London takes over, then New York.
- The overlap between London and New York (in the European afternoon) is usually the most active phase — where most happens.
- Because the market runs continuously, there are practically no price gaps during the week — the next price follows directly from the last.
Timeframes: The Resolution of the Image
A timeframe defines how much time a single candle summarizes. On H1, each candle represents one hour. On D1, it represents a whole day. This learning path works with five levels:
| Abbreviation | One candle = | Typical view |
|---|---|---|
| M15 | 15 Minutes | Fine-tuning during the day |
| H1 | 1 Hour | the day in detail |
| H4 | 4 Hours | the week in detail |
| D1 | 1 Day | weeks and months |
| W1 | 1 Week | the big picture |
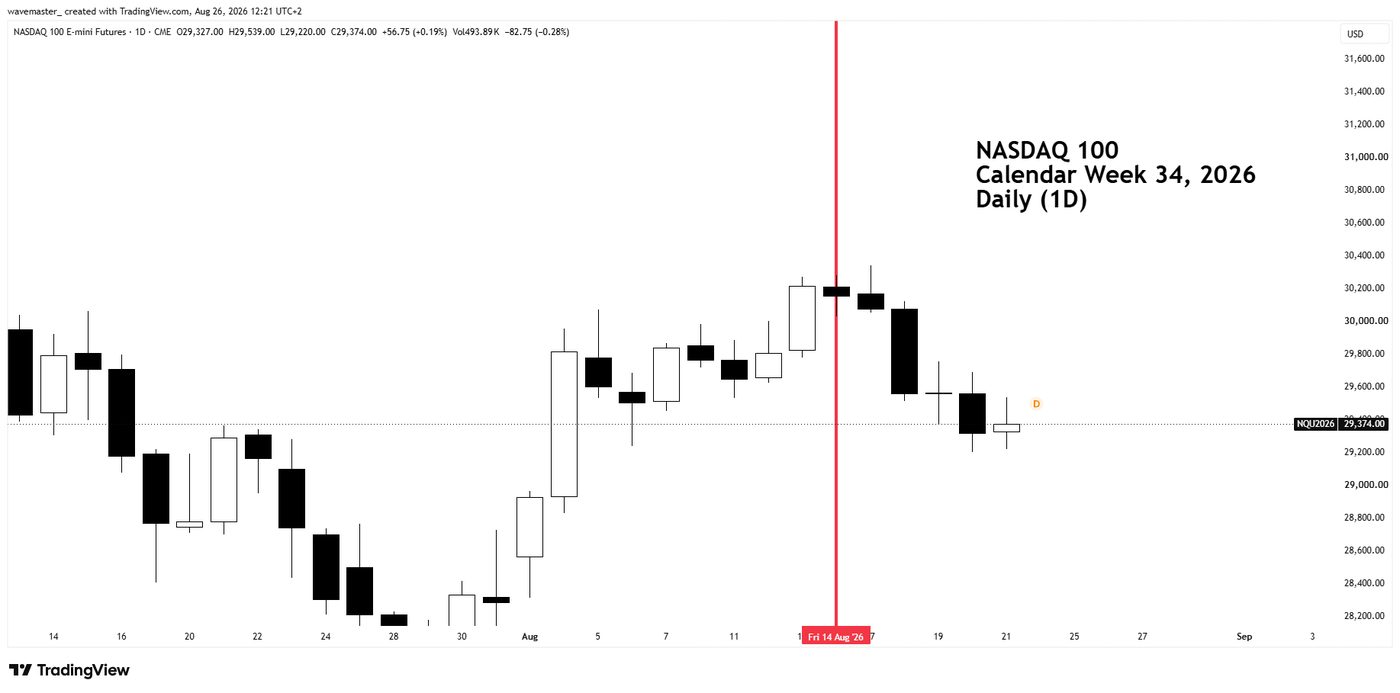
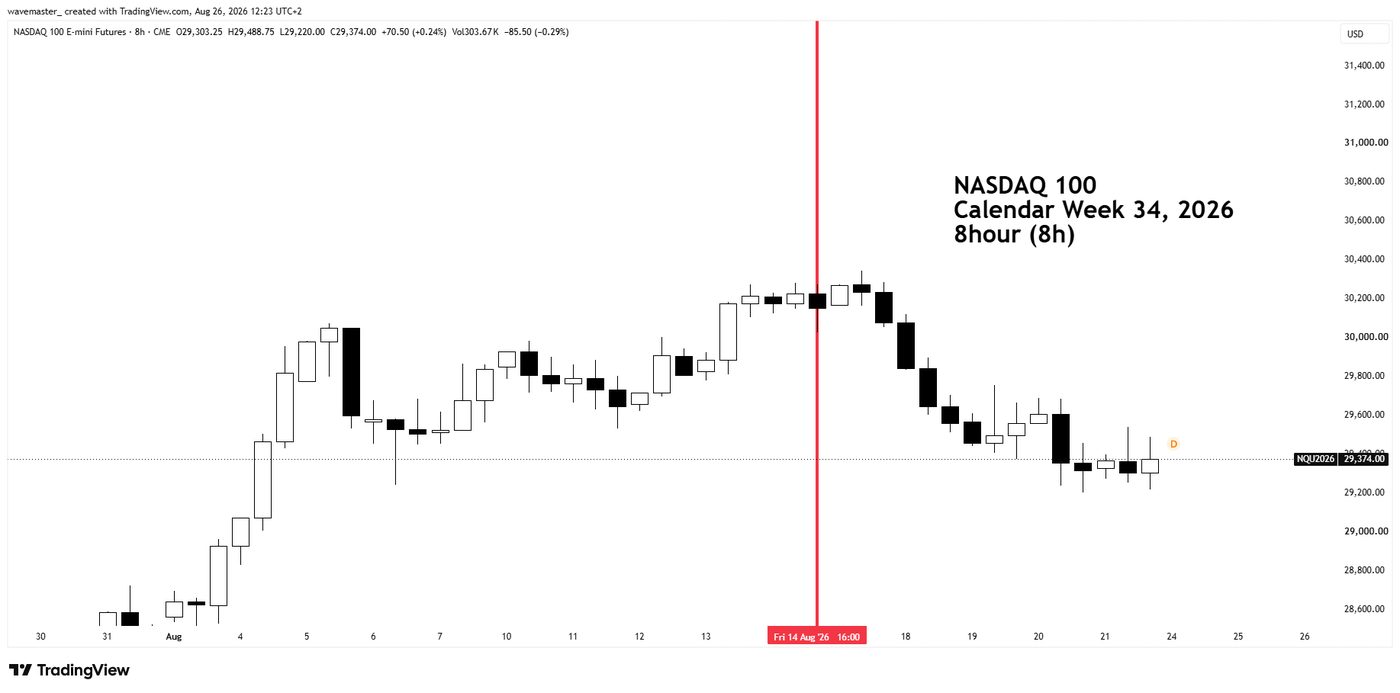
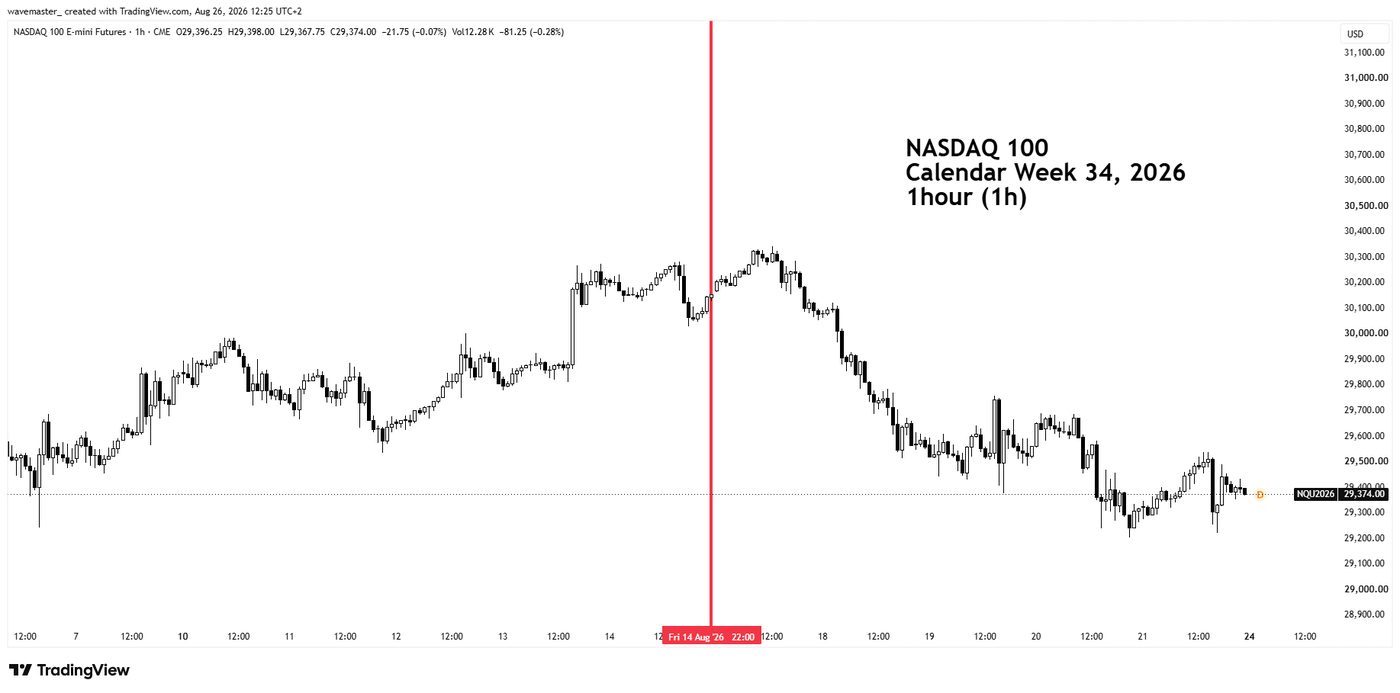
Hold on to this thought. In Module 1, it will become one of the most astonishing properties of markets: The patterns you see on the weekly chart reappear on the hourly chart — smaller, but built according to the same rules.
My first mistake as a beginner wasn't a bad trade — it was believing the M5 chart was 'the market'. Today I know: The market is the building. Timeframes are just the floors from which you look out the window.
Knowledge check
1. GBPUSD falls from 1.2700 to 1.2650. Which currency strengthened — and how many pips was that?
2. How many H4 candles are in a D1 candle?
3. Why are there practically no price gaps in FX during the week?
4. What do you change when you switch from D1 to H1?