
Lesson 0.2
The candle
Four prices, one body, two wicks – read candles before interpreting them
Four Prices, One Figure
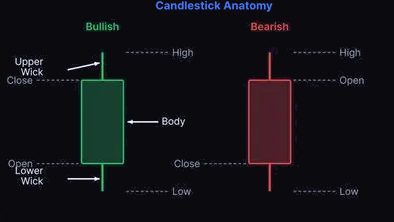
A candle summarizes a period of time — 15 minutes, an hour, a day, depending on the timeframe. It stores four prices:
- Open — the first price of the period
- High — the highest price
- Low — the lowest price
- Close — the last price
These four prices form the figure: The thick part between Open and Close is called the body (German: Körper). The thin lines above and below it are called wicks or shadows — they extend to the High and the Low.
The Body: Who Won?
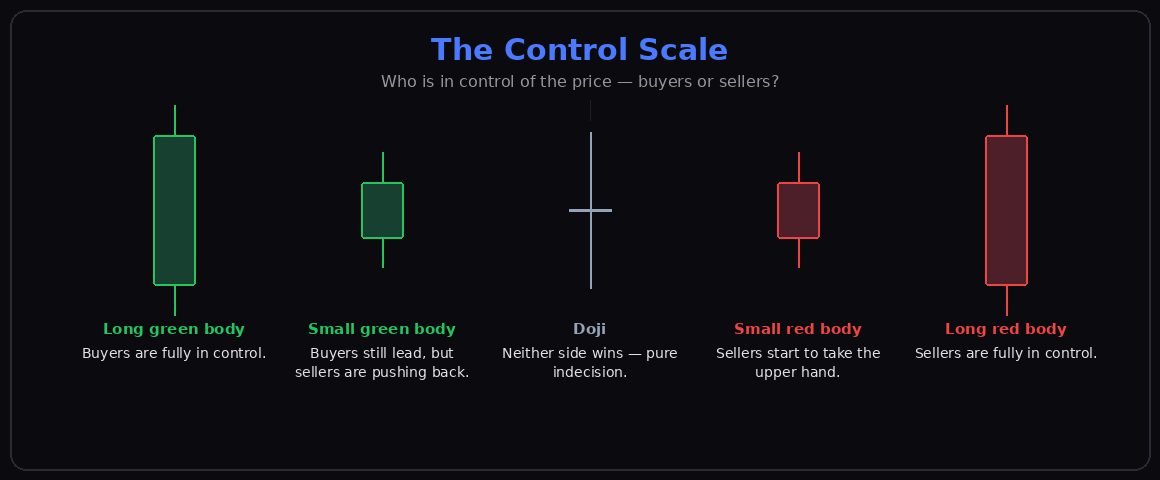
The body is the heart of the candle. It answers the one question that matters: Who was in control during this period?
- If the candle closes above its open, buyers have won. The candle is bullish (rising) — mostly green or white in charts.
- If it closes below its open, sellers have won. The candle is bearish (falling) — mostly red or black.
The size of the body shows how clear the victory was. A long body means: One side clearly dominated. A small body means: The forces were roughly balanced. If Open and Close are (almost) equal, a Doji forms — the round ended in a draw.
The Wicks: Which Prices Were Rejected
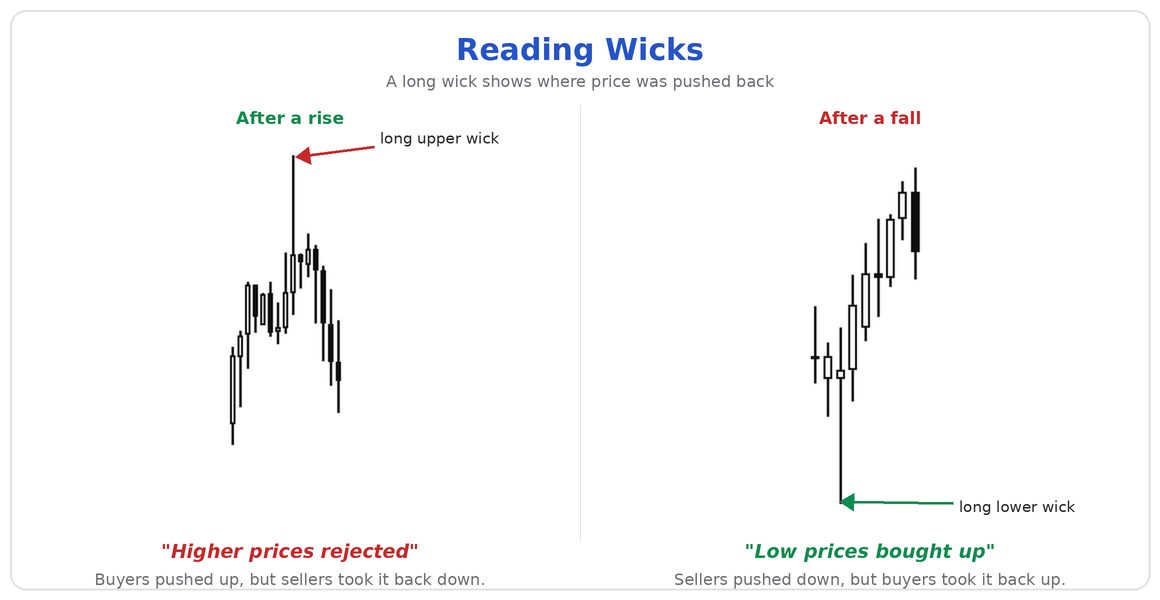
A long upper wick means: Higher prices were reached but not sustained — the market rejected them. A long lower wick means the opposite: Low prices were offered and bought up — sellers could not push through.
What this Lesson Deliberately DOES NOT Teach
As a beginner, I memorized patterns before I could truly read a single candle — it was like cramming vocabulary without knowing the alphabet.
Knowledge check
1. A candle: Open 1.0800, High 1.0860, Low 1.0795, Close 1.0850. Bullish or bearish?
2. What does a Doji mean?
3. What does a long lower wick tell us?
4. Why doesn't this module teach candlestick patterns?