
Lesson 0.5
Risk management & R
1R, the position-size calculation and the risk-reward ratio
The Reverse Order
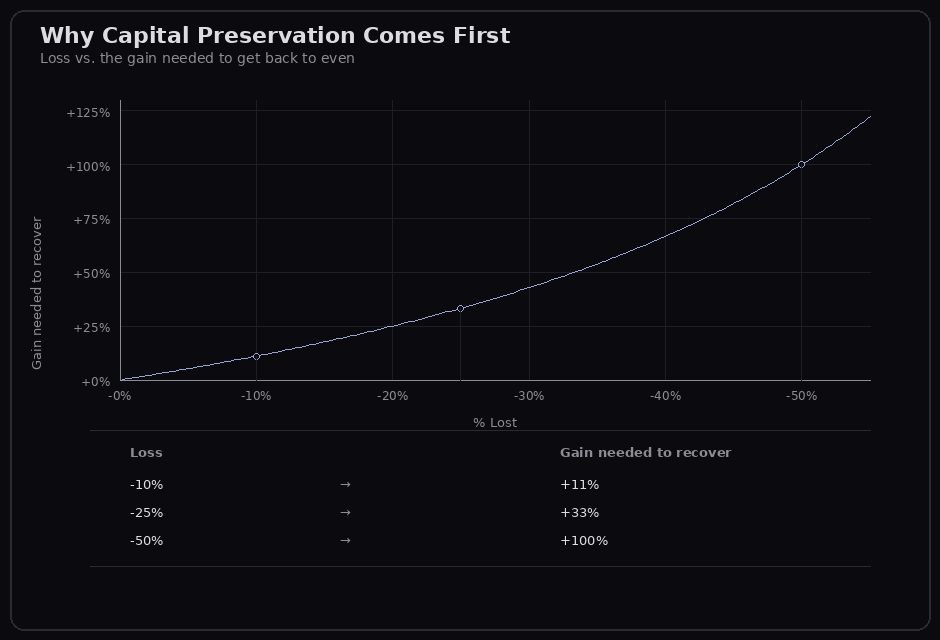
Beginners first ask: "How much can I win?" Pros first ask: "How much can I afford to lose?" — and everything else follows from that number. The reason is simple math: losses weigh more heavily than gains. Anyone who loses 50% of their account needs a 100% gain just to get back to zero. Capital preservation is therefore the first task — profits are the second.
Rule 1 — never lose money. Rule 2 — never forget Rule 1.
R: The Most Important Number in Your Trading
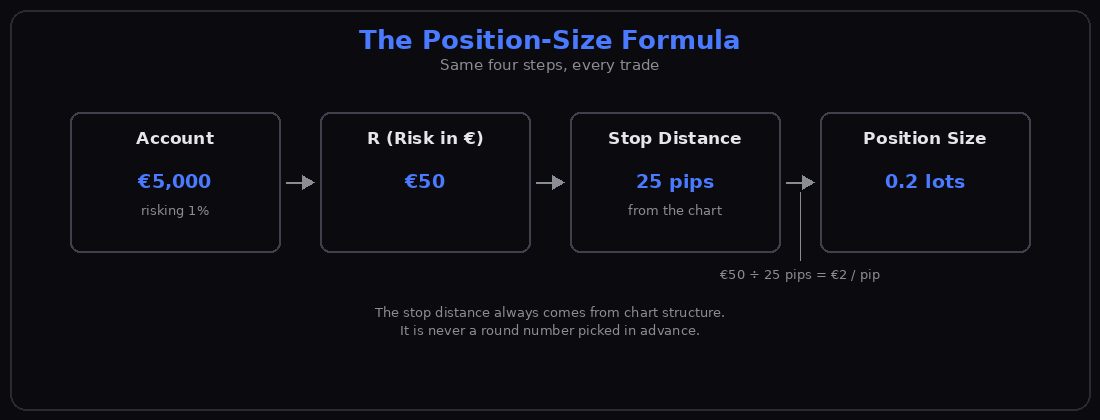
The planned maximum loss of a trade has a name: R (for Risk). 1R = the amount you lose if your stop-loss is triggered. No more — because the stop closes the position beforehand. That's exactly what it's for. You set your R before you even think about a trade — as a fixed fraction of your account. A common convention among learners is around one percent (a description of common practice, not a recommendation). For a €5,000 account and 1%, 1R would be €50.
The Basic Calculation: From R to Position Size
1. Your R in monetary value (from account and percentage): e.g., €50. 2. Your Stop Distance in Pips (where the stop logically sits — determined by the chart, never by
3. The pip value of your position size (from Lesson 0.4).
Look at what this sequence accomplishes: The chart determines the stop. The stop determines the size. Your R always remains the same — regardless of whether the stop is 15 or 60 pips away. Tighter stop = larger position, wider stop = smaller position, identical risk.
The Ratio: What a Trade Should Earn
With R, the target also gets a measure: the Risk-Reward Ratio (short R/R). If your target is 50 pips away and your stop is 25 pips, the ratio is 2:1 — you risk one to gain two.
The deeper meaning: With a good ratio, you don't have to be right more often than wrong to come out ahead. Anyone who trades 2R winners against 1R losers is profitable with a 40% win rate. This insight takes the pressure off individual trades.
| 10 Trades | Number | Result per Trade | Total |
|---|---|---|---|
| Winners | 4 | +2R | +8R |
| Losers | 6 | −1R | −6R |
| Total | 10 | — | +2R |
Two final terms: Drawdown is the decline of your account from its peak — the dip in the curve. And position size, stop, and R together are what pros call Money Management.
What's Next
That was Module 0. You can now read a chart, describe every candle in a sentence, recognize trends and zones, name every order — and you know what 1R is. In Module 1, what WaveMaster exists for begins: You will learn why the swings from Lesson 0.3 are no coincidence — but waves with rules that can be counted.
My trading matured the day the question changed from "how much can I win?" to "how much can this trade cost?
Knowledge check
1. What is 1R?
2. Your R is €80, your stop is 40 pips away. How much can one pip be worth to you?
3. In what order is position size determined?
4. Why can a trader with a 40% win rate be profitable?
5. What is a Drawdown?