
Lesson 0.3
Trend, support & resistance
Swing points, the three market states and the change of polarity
Trend: The Market's Direction
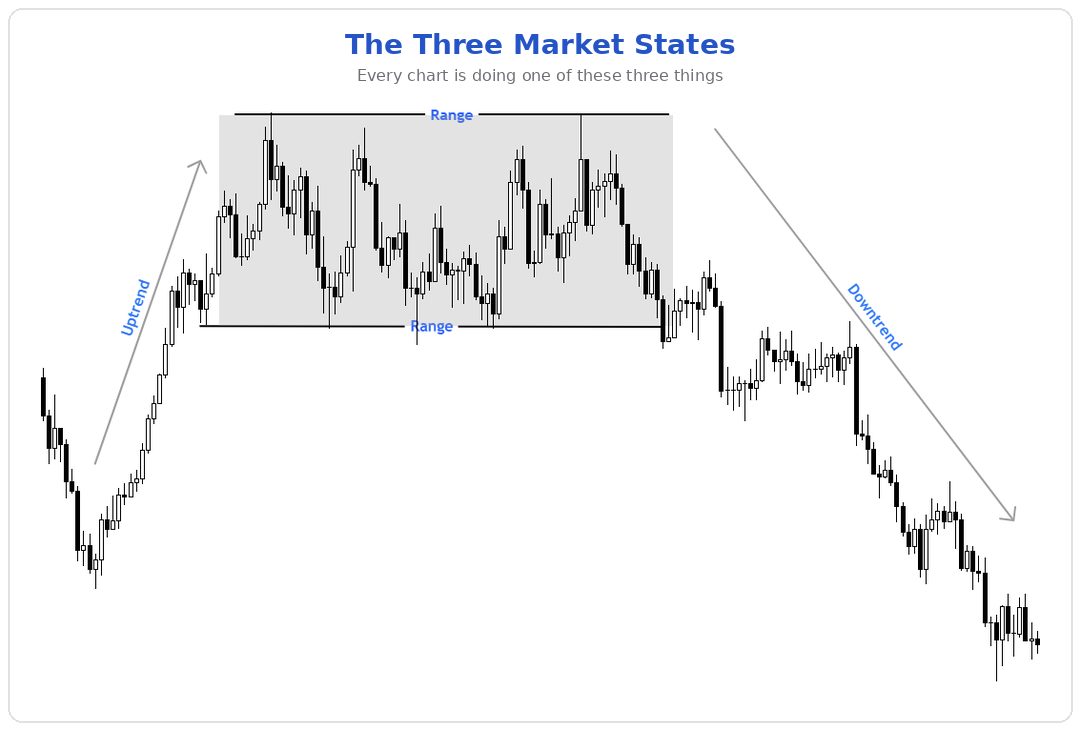
Markets don't move in straight lines. They move in swings: up, back, higher, back. The turning points of these swings are called Swing Highs and Swing Lows — the small peaks and valleys on the chart.
- Uptrend: higher highs and higher lows.
- Downtrend: the mirror image — lower lows and lower highs.
- Sideways Phase (Range): Highs and lows remain approximately at the same level. The market oscillates within a band.
And a preview: The swings you learn to count here are not random wiggles. They follow patterns with rules — and these patterns have a name: Waves. From Module 1, your swing highs and swing lows will get numbers, rules, and addresses.
Support & Resistance: The Market's Zones
Some price areas have memory. If the market repeatedly falls to the same area and reverses upwards there each time, this area is called Support. If it repeatedly rises to the same area and reverses downwards there, it is Resistance.
- Think in zones, not in lines. The market rarely reverses to the exact pip — support is an area,
- The more often tested and the sharper the reaction, the more important the zone.
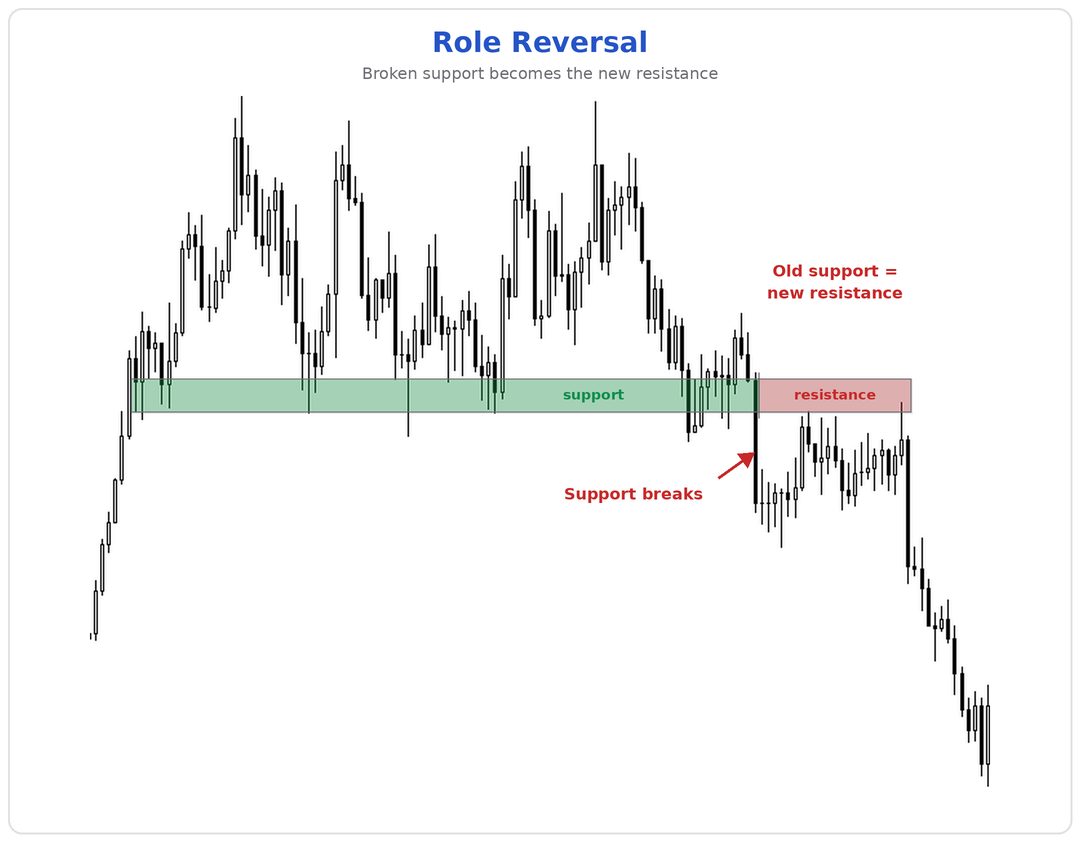
- Broken zones swap roles. If the market clearly breaks below support, this exact area often
The technical term for Rule 3 is Change of Polarity. Why this works is simple psychology: Those who bought at the old support and are now at a loss are happy to "get out without a loss" on the pullback — and sell exactly there.
Finally, the Trend Line: a straight line that connects the rising lows in an uptrend (the falling highs in a downtrend). It makes the trend visible and serves as a sloping zone. You don't need more than this yet.
If I could only give a beginner one single thing from classical chart analysis, it would be the Role Reversal. Broken support becomes resistance — this one sentence explains more market behavior than most indicators combined.
Knowledge check
1. How do you recognize an uptrend — by what two characteristics?
2. Why should you think of Support and Resistance as zones?
3. Clear support is broken. What do you expect on the next approach from below?
4. Do markets spend most of their time trending or in sideways phases?