
Lesson 1.1
Why waves?
Market action as an expression of collective psychology
In short: News doesn't move the market — the mood of market participants
determines how news is perceived. This mood moves in cycles. And because every
change in mood immediately translates into buying and selling, the chart records
these cycles directly.
The Discovery
In the 1930s, an American accountant named Ralph Nelson Elliott analyzed decades of price data from the US stock market — from yearly charts down to hourly data. His finding was outrageous for its time: Price movements are not chaotic. They follow recurring patterns that have the same form on all timeframes and unfold according to describable rules. From this observation, the Elliott Wave Principle was born — the model taught in this entire learning path.
Why Would a Market Form Patterns?
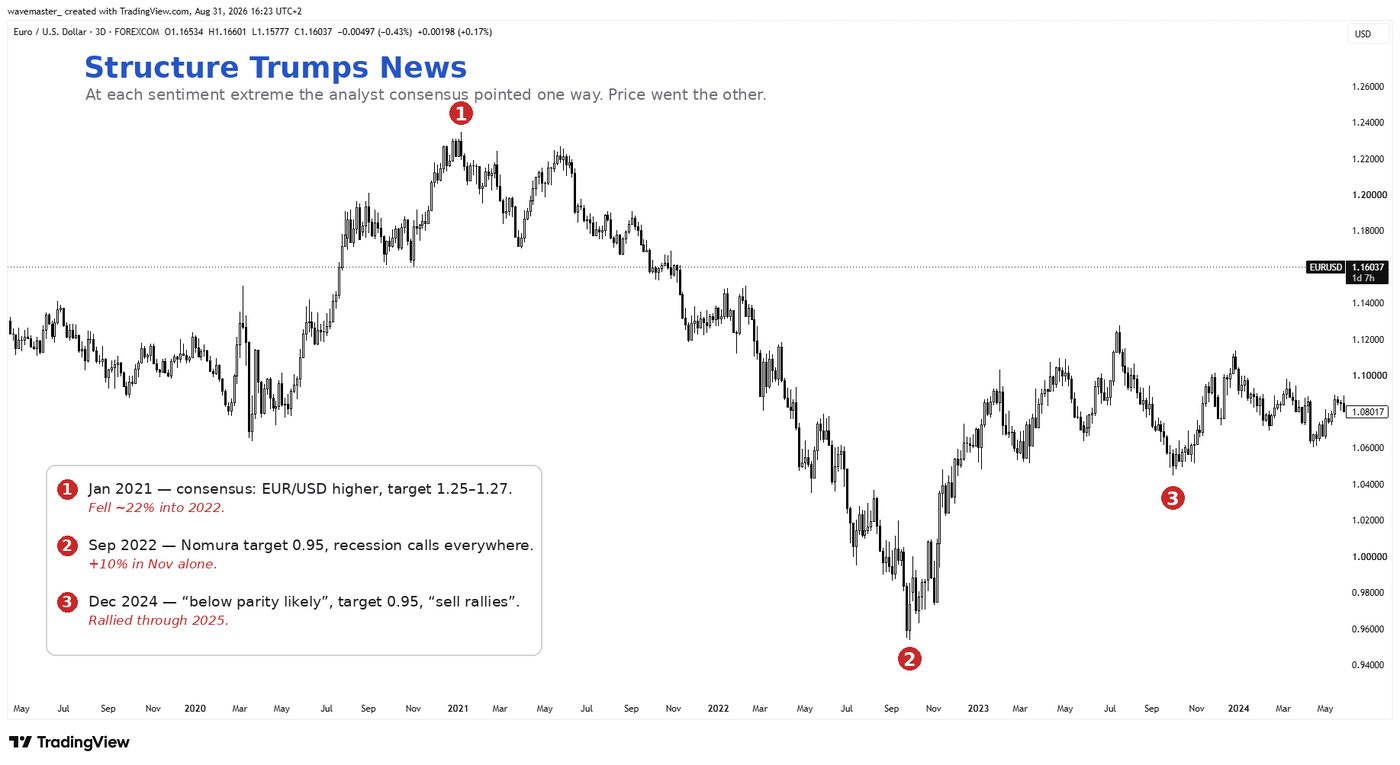
You know the usual explanation for price movements: news and economic data drive prices. But anyone who has observed markets for a while knows the counterexamples. Markets fall on good numbers. They rise on bad ones. They ignore a crisis for weeks — and then collapse for no apparent reason.
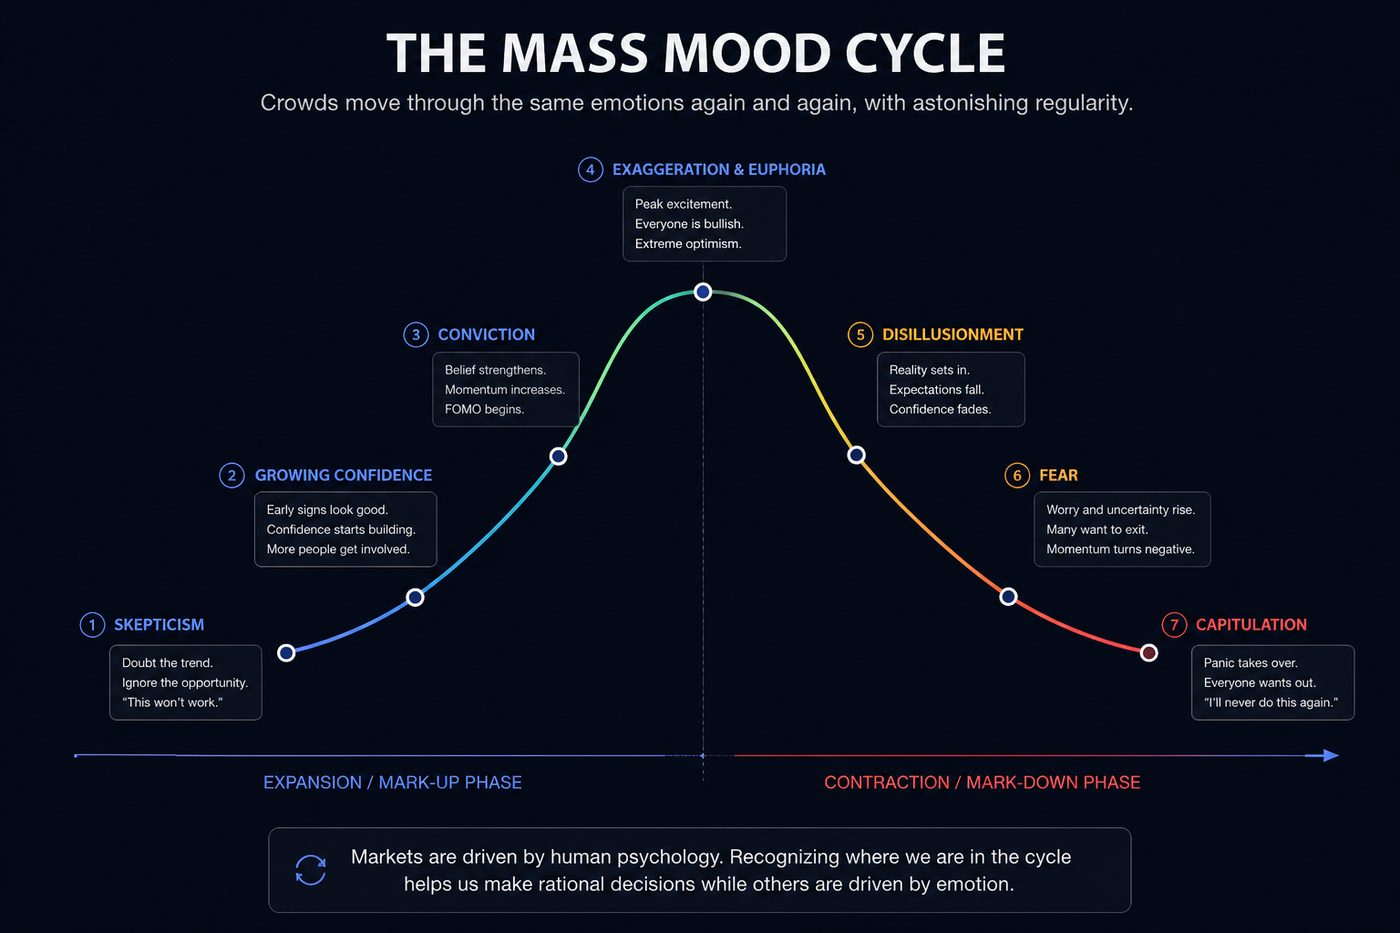
This collective mood is not a random variable. People in large groups go through mood cycles with astonishing regularity: Skepticism → growing confidence → conviction → exaggeration and euphoria → disillusionment → fear → capitulation. And all over again. In the market, every change in mood immediately translates into buy and sell decisions. That's why the chart is more than just a price record: It is a continuous record of mass psychology. You don't need to know why millions of people are buying. It's enough to know that markets are made of people — and that people react the same way again and again in comparable situations.
What the Wave Principle Does — and What It Doesn't
1. It's a probability model, not a prediction machine. It provides a ranking of possible scenarios
2. Its real strength is its testability. Every scenario defines price levels at which it becomes
3. The mindset is anticipating, not forecasting. Identify high-probability targets — while
4. It works where many people trade. Liquid currency pairs, indices, commodities — the more
A True Story to Conclude
How precise this "record of mass psychology" can be is shown by a documented episode from the daily work of wave analyst Robert Balan. In early June 1986 the dollar had been rising for weeks and sentiment was clearly bullish. Balan, however, read the ongoing rally not as a trend but as a last hurrah — the B wave of a large flat pattern, a trap right before the downtrend resumed.
In his daily commentary on the Reuters network he had publicly announced that this sideways pattern would resolve and that its end would also mark the end of the entire dollar rally. When the pattern tightened into a horizontal triangle on the 10-minute chart — for him a reliable herald of the final move — he typed his take-profit and reverse call into the Reuters network.
Roughly twenty minutes later, just five points shy of the calculated turning point at 2.3430 (USD/DEM at the time), the dollar turned. An hour later it was two pfennigs lower; ten days later, sixteen. No insider knowledge, no news — only the structure.
Source: Robert Balan, The Wave Analyst, Introduction, p. I-2.
My Elliott moment was the day I stopped reading the news and started reading the reactions. The calendar tells me when something will happen. The structure tells me what the market will do with it.
Knowledge check
1. According to the Wave Principle, what is the primary cause of the structure in price movements?
2. Why can the same news trigger rising prices at one time and falling prices at another?
3. What is the key methodological strength of Wave Analysis?
4. True or false: 'The Wave Principle always provides exactly one certain prediction.'
5. In a chart showing a rally followed by a crash, at which point was collective confidence at its highest?